|
|
Post by acidohm on Aug 24, 2020 20:28:15 GMT
The 1st graph describes ITCZ??
|
|
|
|
Post by nautonnier on Aug 24, 2020 22:59:36 GMT
The 1st graph describes ITCZ?? Yes it would if it were not two dimensional. The 'convergence' is created by the equatorward flows at the base of the Hadley cells North and South of the equator. This 4 dimensional view makes it difficult to envisage the Walker circulation as the entire base of that circulation id made up of the convergence from North and South of the winds at the base of the Hadley cells. That is really what I meant by the simplistic two dimensional approach hiding the complexity. You do not need much simplification in a chaotic system for the model output to be wildly different and divergent from reality. |
|
|
|
Post by sigurdur on Aug 25, 2020 3:40:14 GMT
The entire area of 'circulations' and 'patterns' is interesting. All these rules of thumb based on pressure differences or perceived circulations are very 2 dimensional. One thing the atmosphere is not is 2 dimensional. So the Walker circulation (cells) 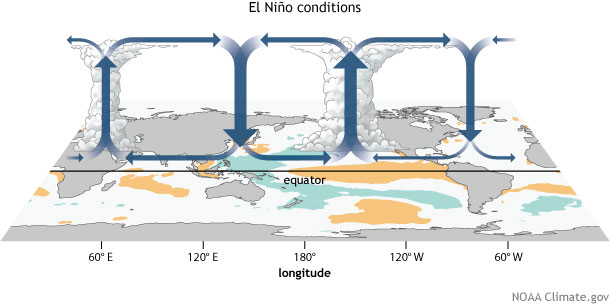 Cannot really be separated from the latitudinal Hadley, Ferrel and Polar cells....  and the associated Coriolis force and subsequent geostrophic winds  The surface level winds affects the ocean circulations and the ocean circulations affect the surface level winds The sea surface temperature affects the air temperature, humidity and convection which drives the Hadley cells and Walker circulation which drive the surface level winds... You can see why the mathematicians used to trying to 'simplify' by treating complex variables as constants 'for this calculation' can get results that are completely at odds with what is happening. And all this is without including jet streams and Rossby waves leading to meridional or latitudinal jet stream patterns that are formed by the boundaries between ascending/descending air between the cells - which came first the boundaries between the cells or the Rossby waves in the jet streams? Nor has it included the Thermo Haline Currents in the ocean especially those like the cold Humboldt and Labrador currents surfacing All of these circulations beg the question which comes first? It is not possible to use 2 dimensional approaches to describe a chaotic 4 dimensional system. You forgot the MJO cycles. |
|
|
|
Post by nautonnier on Aug 25, 2020 12:32:09 GMT
The entire area of 'circulations' and 'patterns' is interesting. All these rules of thumb based on pressure differences or perceived circulations are very 2 dimensional. One thing the atmosphere is not is 2 dimensional. So the Walker circulation (cells) Cannot really be separated from the latitudinal Hadley, Ferrel and Polar cells.... and the associated Coriolis force and subsequent geostrophic winds The surface level winds affects the ocean circulations and the ocean circulations affect the surface level winds The sea surface temperature affects the air temperature, humidity and convection which drives the Hadley cells and Walker circulation which drive the surface level winds... You can see why the mathematicians used to trying to 'simplify' by treating complex variables as constants 'for this calculation' can get results that are completely at odds with what is happening. And all this is without including jet streams and Rossby waves leading to meridional or latitudinal jet stream patterns that are formed by the boundaries between ascending/descending air between the cells - which came first the boundaries between the cells or the Rossby waves in the jet streams? Nor has it included the Thermo Haline Currents in the ocean especially those like the cold Humboldt and Labrador currents surfacing All of these circulations beg the question which comes first? It is not possible to use 2 dimensional approaches to describe a chaotic 4 dimensional system. You forgot the MJO cycles. I did but the Madden Julian cycles are a little different again - perhaps the MJO is a second order effect. If you look at the ITCZ where the convection is the most 'exciting' with the cloud tops of the CB up at 70,000ft with air rushing in at the base of the clouds and rising at over 100kts vertical speed. This is a 4 dimensional effect. Then the actual position of the ITCZ slowly wanders North/South between tropics of Cancer and Capricorn between Northern and Southern Hemisphere summers....  The drives the changes in the jet stream boundaries between Hadley/Ferrel/Polar cells and the tracks of the weather systems in the Ferrel cells are over more or less land. Those jet streams are meridional or latitudinal and the loops slowly track around the globe Does this actually cause the MJO? |
|
|
|
Post by missouriboy on Aug 25, 2020 14:16:00 GMT
These are the "classic" NH summer and winter atmospheric pressure setups. Longer-term, solar-induced(?) deviations from these norms, together with their associated precipitation patterns would make for a most interesting on-line atlas. I have yet to see one. But one could imagine / speculate on how a weakening of the Azores high in summer might drive the decrease in rainfall in central Europe (as per Dresi) and how these may be related to changes in solar activity, etc. Same for monsoonal variance. What setups have been driving the increasing precipitation patterns across the Med? So many other questions. Since climates are expected averages (and normal variances from those averages), the huge databases that have accumulated over the last few decades are a physical geographers dream (if they had access and the computing power).  It's really the same thing that's being done for shorter-term forecasting but focusing on longer-period geographic changes and trends. People are doing this (at least in pieces) but they are not being widely distributed. Perhaps the CIA/NSA.  We have discussed theories of how declines solar activity might affect equatorial pressures and resulting sub-tropical highs. A visualization using real data is sadly lacking.   |
|
|
|
Post by acidohm on Aug 25, 2020 14:26:23 GMT
|
|
|
|
Post by nautonnier on Aug 25, 2020 16:39:38 GMT
Interesting. Perhaps the MJO is not a 'thing' it is a behavior, an 'emergent behavior'. "Emergent behavior is behavior of a system that does not depend on its individual parts, but on their relationships to one another. Thus emergent behavior cannot be predicted by examination of a system's individual parts. It can only be predicted, managed, or controlled by understanding the parts and their relationships. Emergent behavior is also known as emergence, emergent property, or “the whole is greater than the sum of the parts.” "Interesting Video So perhaps the MJO happens due to the interactions of the other parts of the ocean and atmospheric interactions. We see the MJO as a 'thing' but in fact it is just an emergent behavior. So trying to study it as if it was an independent 'thing' will not work like trying to study the movements of a flock of birds without the birds. |
|
|
|
Post by acidohm on Aug 25, 2020 19:01:36 GMT
Interesting. Perhaps the MJO is not a 'thing' it is a behavior, an 'emergent behavior'. "Emergent behavior is behavior of a system that does not depend on its individual parts, but on their relationships to one another. Thus emergent behavior cannot be predicted by examination of a system's individual parts. It can only be predicted, managed, or controlled by understanding the parts and their relationships. Emergent behavior is also known as emergence, emergent property, or “the whole is greater than the sum of the parts.” "Interesting Video So perhaps the MJO happens due to the interactions of the other parts of the ocean and atmospheric interactions. We see the MJO as a 'thing' but in fact it is just an emergent behavior. So trying to study it as if it was an independent 'thing' will not work like trying to study the movements of a flock of birds without the birds. Thats *VERY* interesting. If you Google emergence, you also find complex system theory....which seems to be quite a new science. Possibly derived from investigating ways to control nano swarms or computer networks?? |
|
|
|
Post by acidohm on Aug 25, 2020 19:05:07 GMT
It is not possible to use 2 dimensional approaches to describe a chaotic 4 dimensional system. Exactly true. Theres so many processes we know, we also know that, maybe some, to much of the time, if A and B do one thing the result is C in an area of the world. However even if the same conditions arise a second time, the result could be 'D', because Chaos....and we would never be able to quantify why. Of course....this is an incredible oversimplification. |
|
|
|
Post by blustnmtn on Aug 28, 2020 21:21:55 GMT
Interesting. Perhaps the MJO is not a 'thing' it is a behavior, an 'emergent behavior'. "Emergent behavior is behavior of a system that does not depend on its individual parts, but on their relationships to one another. Thus emergent behavior cannot be predicted by examination of a system's individual parts. It can only be predicted, managed, or controlled by understanding the parts and their relationships. Emergent behavior is also known as emergence, emergent property, or “the whole is greater than the sum of the parts.” "Interesting Video So perhaps the MJO happens due to the interactions of the other parts of the ocean and atmospheric interactions. We see the MJO as a 'thing' but in fact it is just an emergent behavior. So trying to study it as if it was an independent 'thing' will not work like trying to study the movements of a flock of birds without the birds. Thats *VERY* interesting. If you Google emergence, you also find complex system theory....which seems to be quite a new science. Possibly derived from investigating ways to control nano swarms or computer networks?? I met a fellow at an awards dinner about10 years ago that was involved in the study of “group behavior” (schools of fish, flocks of starlings) to apply it to swarms of drones. I believe it was military related but he didn’t say 😳 Seems similar. |
|
|
|
Post by acidohm on Aug 29, 2020 7:43:41 GMT
The entire area of 'circulations' and 'patterns' is interesting. All these rules of thumb based on pressure differences or perceived circulations are very 2 dimensional. One thing the atmosphere is not is 2 dimensional. So the Walker circulation (cells) Cannot really be separated from the latitudinal Hadley, Ferrel and Polar cells.... and the associated Coriolis force and subsequent geostrophic winds The surface level winds affects the ocean circulations and the ocean circulations affect the surface level winds The sea surface temperature affects the air temperature, humidity and convection which drives the Hadley cells and Walker circulation which drive the surface level winds... You can see why the mathematicians used to trying to 'simplify' by treating complex variables as constants 'for this calculation' can get results that are completely at odds with what is happening. And all this is without including jet streams and Rossby waves leading to meridional or latitudinal jet stream patterns that are formed by the boundaries between ascending/descending air between the cells - which came first the boundaries between the cells or the Rossby waves in the jet streams? Nor has it included the Thermo Haline Currents in the ocean especially those like the cold Humboldt and Labrador currents surfacing All of these circulations beg the question which comes first? It is not possible to use 2 dimensional approaches to describe a chaotic 4 dimensional system. This is essentially a diagram of walker cells...as an expression of land/ocean interaction? |
|
|
|
Post by missouriboy on Aug 29, 2020 17:51:19 GMT
There is geographic structure in that chaos.
cha•os kā′ŏs″►
n. A condition or place of great disorder or confusion.
n. A disorderly mass; a jumble.
n. The disordered state of unformed matter and infinite space supposed in some cosmogonic views to have existed before the ordered universe.
If it was total chaos, would you see geographic clustering? Ditto for temporal clustering?
|
|
|
|
Post by missouriboy on Aug 29, 2020 18:33:46 GMT
Current Status on Solar Cycle 25 Progression and Historical Comparisons
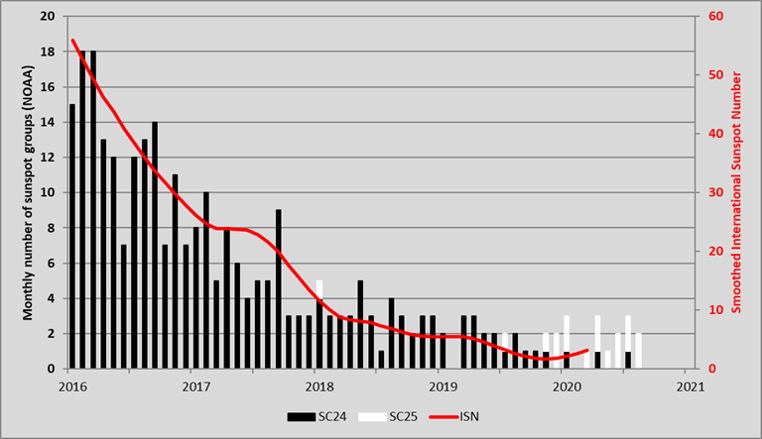 Since no one has pronounced a start date for SC25, I am selecting November, 2019 based on the observations on SC24 and SC25 sunspots in the above chart. November 2019 also corresponds with the lowest monthly tallies of sunspots for this time period. This would mean that SC25 is about to finish its 10th month. When compared to other solar cycles in our time series, which go back to 1823, we see that (based on this assumption) SC25 has the smallest accumulation of sunspots over its initial 10-month period of any solar cycle going back to SC7 (1823-1833). SC7 immediately followed the 2-cycle Dalton Minimum (SC 5 and 6). This relationship may change as SC25 "fires up", but so far, tallies are way below the similar period during SC24. My August 2020 value is based on 29 days, of which the last 8 have recorded NO sunspots. If tomorrow and Monday record some sunspots, then this chart will change, but probably not dramatically. There is also a question regarding the number of daily sunspots recorded in the early years of our time series versus present day ... as present day observation techniques may yield more sunspots. It is unfortunate that daily sunspot observations are not available for SC 5 and 6. However, the second chart provides a comparison of sunspot groups back to 1700 (I believe). A very preliminary visual comparison suggests that, so far, SC25 may compare to the Dalton Minimum. Chart 3 also shows that data from our current record appears much "messier" prior to about 1845. 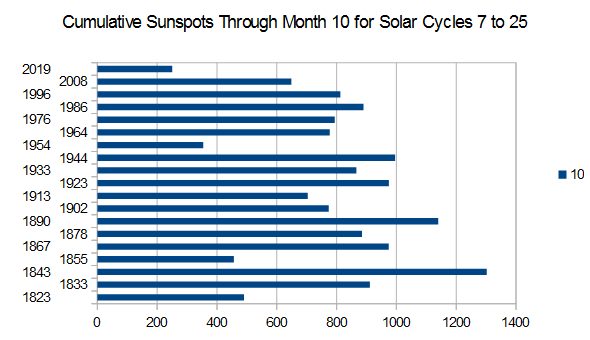 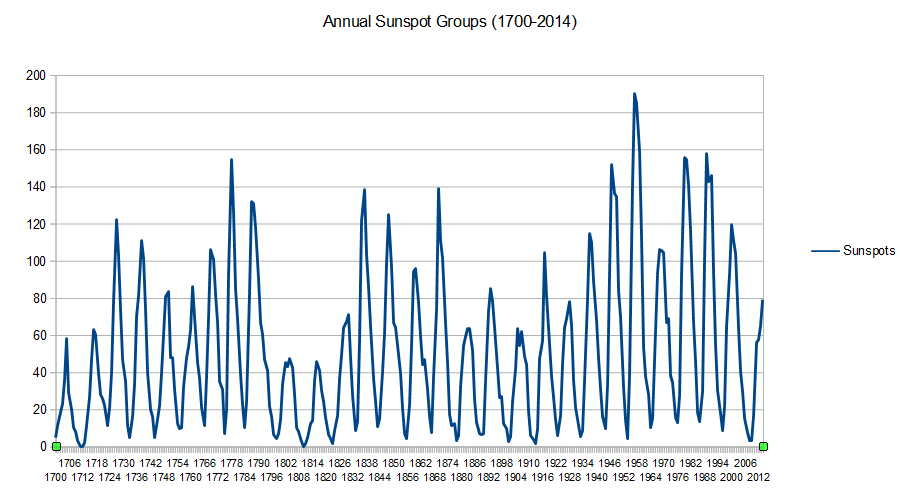 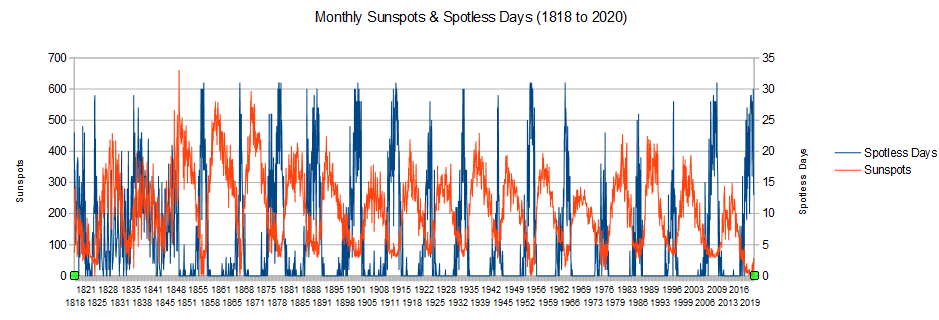
|
|
|
|
Post by acidohm on Aug 29, 2020 18:45:50 GMT
There is geographic structure in that chaos. cha•os kā′ŏs″► n. A condition or place of great disorder or confusion. n. A disorderly mass; a jumble. n. The disordered state of unformed matter and infinite space supposed in some cosmogonic views to have existed before the ordered universe. If it was total chaos, would you see geographic clustering? Ditto for temporal clustering? Order within Chaos is why our universe exists 😉 |
|
|
|
Post by missouriboy on Aug 29, 2020 19:30:56 GMT
So kind of like the postal service deciding to work for a while after they get a new contract? |
|


 It's really the same thing that's being done for shorter-term forecasting but focusing on longer-period geographic changes and trends. People are doing this (at least in pieces) but they are not being widely distributed. Perhaps the CIA/NSA.
  We have discussed theories of how declines solar activity might affect equatorial pressures and resulting sub-tropical highs. A visualization using real data is sadly lacking.