|
|
Post by missouriboy on Jan 25, 2020 9:43:32 GMT
Trying to explain to someone why just because the sun has gone quiet, global temps have not immediately dropped. Came across Thermal Mass and thought this video provide a decent analogy?? Graph at 2:40. youtu.be/l6hIhuW3I-INow fill that concrete bowl with water. |
|
|
|
Post by acidohm on Jan 25, 2020 10:25:59 GMT
Trying to explain to someone why just because the sun has gone quiet, global temps have not immediately dropped. Came across Thermal Mass and thought this video provide a decent analogy?? Graph at 2:40. youtu.be/l6hIhuW3I-INow fill that concrete bowl with water. Exactly.... |
|
|
|
Post by missouriboy on Jan 25, 2020 16:06:00 GMT
Now fill that concrete bowl with water. Exactly.... We're in deep schiff. |
|
|
|
Post by nautonnier on Jan 26, 2020 11:14:18 GMT
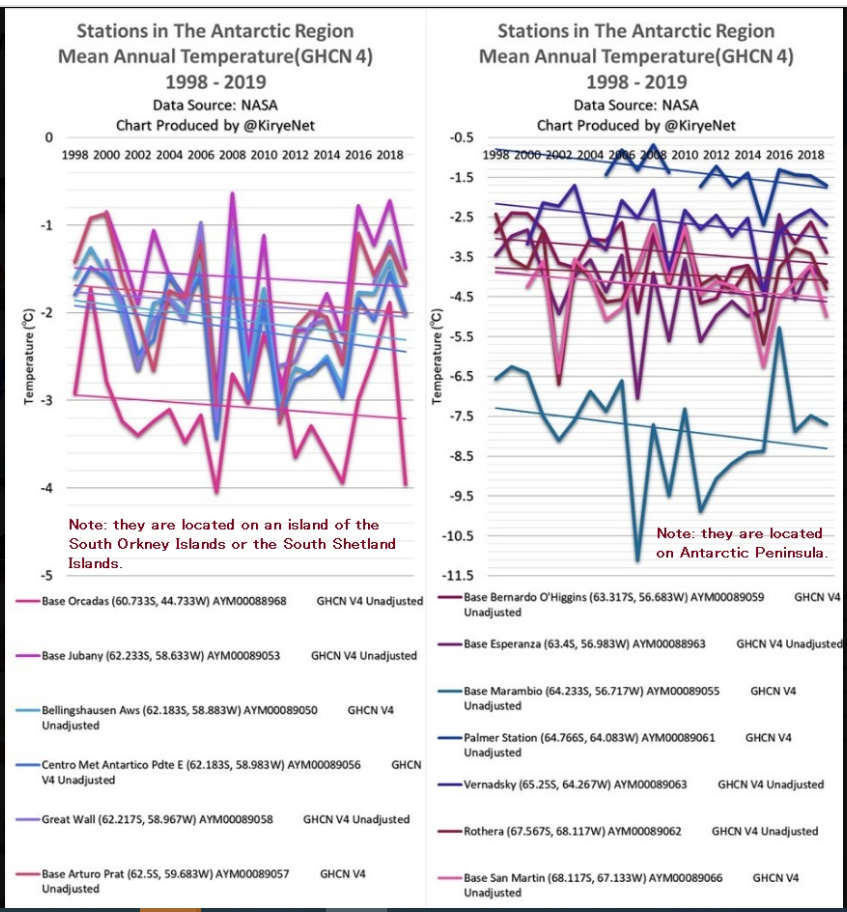
"NASA Data: 13 Of 13 Antarctic Peninsula, Island Stations Show Cooling Trend Over Past 21 Years!
A few days ago we looked at 19 stations scattered across Antarctica and found no unusual climate trends taking place there over the past 31 years.
Today we focus on 13 crucial stations located on and around the Antarctic Peninsula, which alarmists say is threatening to melt down and cause sea level rise to accelerate rapidly, and plot the data from NASA going back to 1998, i.e. 21 years."
|
|
|
|
Post by nautonnier on Feb 27, 2020 4:09:06 GMT
"Could Global Cooling Silently Become A Reality?
Trying to imply that cooling is right around the corner when we’re watching record-breaking warm ocean temperatures to me seems a big stretch, but current facts and the history around the five previous ice ages that came and melted before fossil fuels became recognizable words may be worthy of reviewing.
The real climate crisis may not be global warming, but global cooling, and it may have already started. These events may not be an anomaly, but a predecessor of things to come:
Planting was one month late due to cold Spring weather across the Great Plains of North America in both 2018 and 2019.
In 2019 Spring was wet and cold and ~40% of the huge USA corn crop was not planted.
Summer 2019 was cold, and snow came early in the Fall, and the crop was a failure across much of the Great Plains.
There were good harvests in the USA Southeast and South in 2019, and lots of grain in storage so prices did not escalate – but there were big crop losses across the Great Plains. Also, lots of that grain will be feed grade only, if they do get it off the fields.
The sun activity which is not controlled by humanity or by social media may be formulating a different forecast for the world. Even NASA has imagined a “Little Ice Age” in the future, because of solar activity that rises and falls in 11-year cycles; and the newest one begins this year, 2020."papundits.wordpress.com/2020/02/25/could-global-cooling-silently-become-a-reality/H/t Talbloke's Talkshop
|
|
|
|
Post by missouriboy on Feb 27, 2020 14:42:00 GMT
|
|
|
|
Post by walnut on Feb 27, 2020 14:58:04 GMT
The yardstick to measure culpability should be: units of carbon / units of GDP
The USA won't even show up on that list. The world can eat and thrive mainly because of the US economic engine.
|
|
|
|
Post by Ratty on Feb 27, 2020 23:17:00 GMT
The yardstick to measure culpability should be: units of carbon / units of GDPThe USA won't even show up on that list. The world can eat and thrive mainly because of the US economic engine. Excellent point, Walnut. |
|
|
|
Post by nautonnier on Feb 28, 2020 21:25:43 GMT
"Analyzing changes in the complexity of climate in the last four decades using MERRA-2 radiation data
Abstract
The energy balance of the Earth is controlled by the shortwave and longwave radiation emitted to space. Changes in the thermodynamic state of the system over time affect climate and are noticeable when viewing the system as a whole. In this paper, we study the changes in the complexity of climate in the last four decades using data from the Modern-Era Retrospective analysis for Research and Applications, Version 2 (MERRA-2). First, we study the complexity of the shortwave and longwave radiation fields independently using Approximate Entropy and Sample Entropy, observing that the rate of complexity change is faster for shortwave radiation. Then, we study the causality of those changes using Transfer Entropy to capture the non-linear dynamics of climate, showing that the changes are mainly driven by the variations in shortwave radiation. The observed behavior of climatic complexity could be explained by the changes in cloud amount, and we research that possibility by investigating its evolution from a complexity perspective using data from the International Satellite Cloud Climatology Project (ISCCP)."www.nature.com/articles/s41598-020-57917-8
|
|
|
|
Post by nautonnier on Feb 28, 2020 21:54:13 GMT
|
|
|
|
Post by nautonnier on Mar 2, 2020 14:14:21 GMT
|
|
|
|
Post by douglavers on Mar 3, 2020 1:31:53 GMT
|
|
|
|
Post by acidohm on Mar 3, 2020 4:05:00 GMT
Currently tri-monthly figure is 0.6°c Region 4 hasn't really gone below 1°c in a year. Plenty of subsurface warmth with repeated kelvin waves the past year. Tri-monthly did dip to 0 1°c last year but essentially, UAH is still following ENSO. Nina still forecast for later this year. |
|
|
|
Post by missouriboy on Mar 3, 2020 5:29:37 GMT
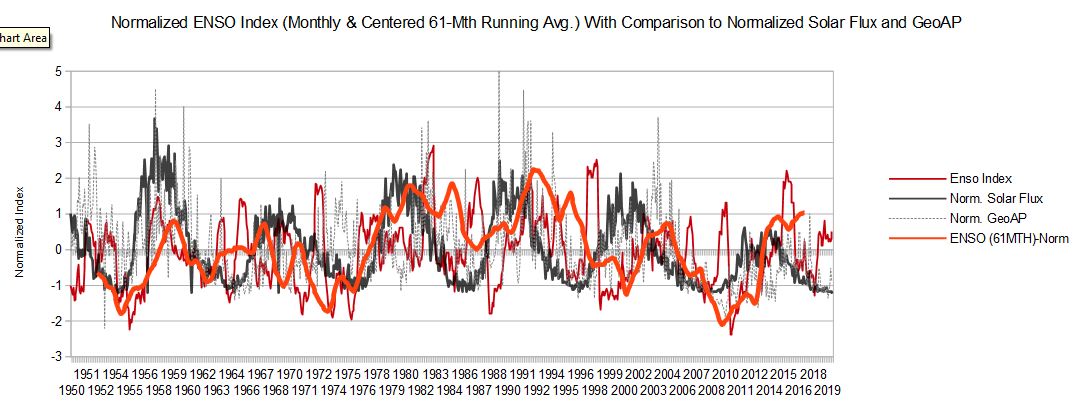
Currently tri-monthly figure is 0.6°c Region 4 hasn't really gone below 1°c in a year. Plenty of subsurface warmth with repeated kelvin waves the past year. Tri-monthly did dip to 0 1°c last year but essentially, UAH is still following ENSO. Nina still forecast for later this year. And ENSO follows solar cycles. And that 20-year recharge is dissipating.  |
|
|
|
Post by neilhamp on Mar 3, 2020 8:20:14 GMT
Missouriboy,
ENSO data v solar cycle interesting
Where is this from?
|
|