|
|
Post by missouriboy on May 21, 2019 23:21:53 GMT
Do they let you sharpen it? Jail time.  Bummer. How do you entertain the criminals? |
|
ant42
Level 3 Rank
 Melbourne, Australia
Posts: 129
|
Post by ant42 on May 22, 2019 8:40:59 GMT
 And we are now officially negative in the Pacific. All that matters now is what sort of La Nina we will see, as I expected. 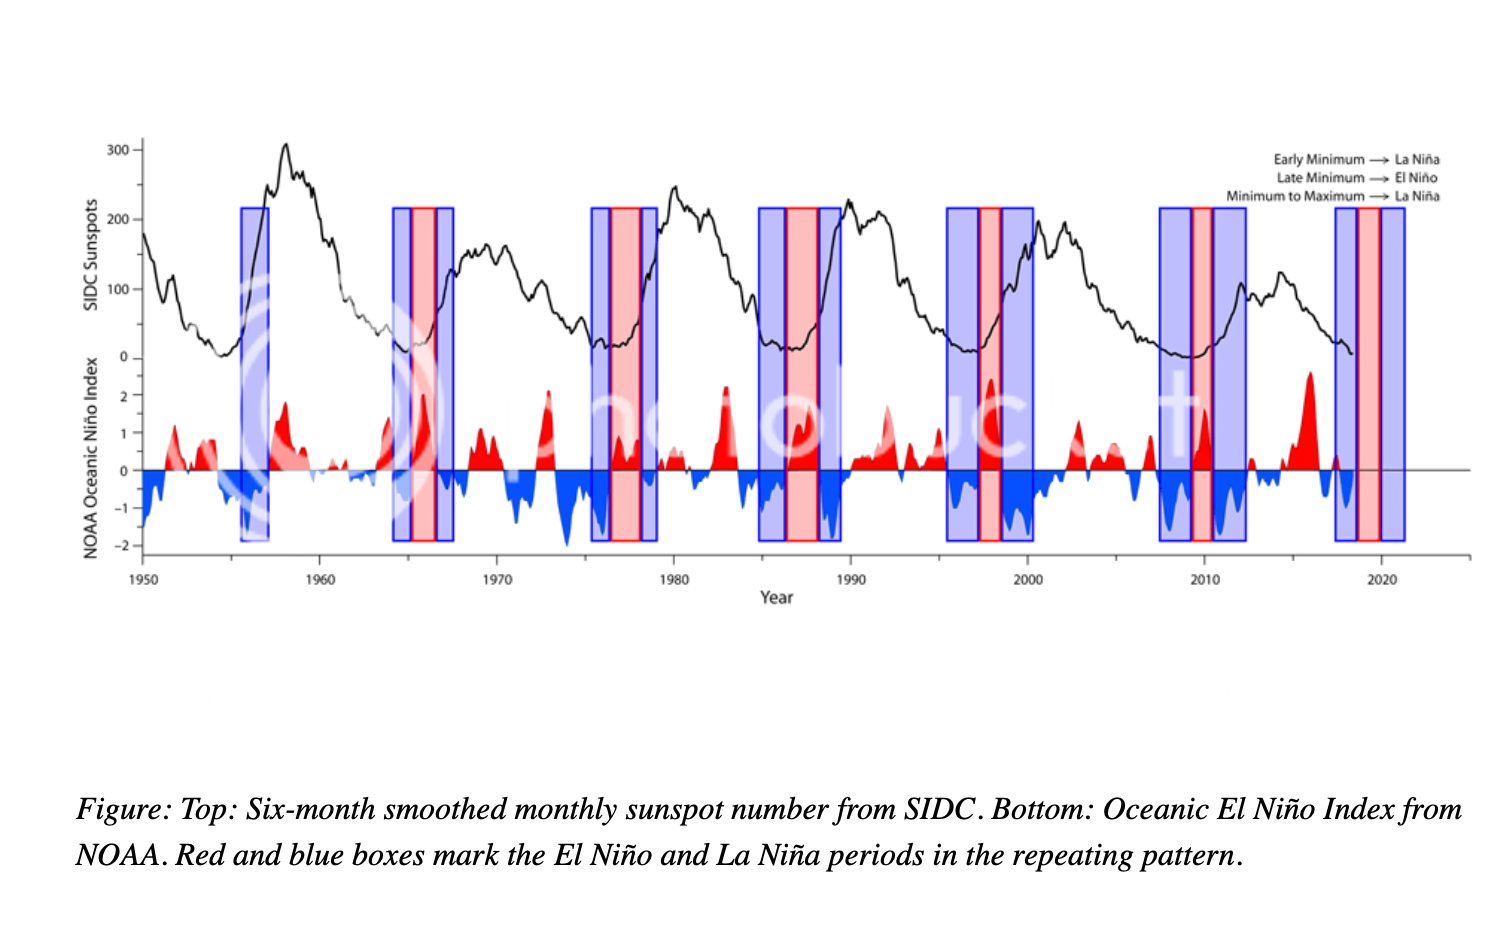 And I think this is going to be right! NASA is saying 2023 for Solar Miminum, this chart suggest minimum is now, and if we do get a La Nina, that would too. |
|
|
|
Post by nautonnier on May 22, 2019 11:22:23 GMT
Or both may be right - the minimum is starting now and the midpoint of the minimum will be 2023 when assessed a few years past that.
Sit back relax and experience the ride.
|
|
|
|
Post by duwayne on May 22, 2019 16:03:48 GMT
Anthony, the Australian BOM says the solar minimum likely occurred in March. NOAA's ENSO prediction record is poor. It's looking like your prediction that the El Nino will end in mid-2019 is proving to be accurate. If 2019 follows the 2010 pattern as you predicted and the 1998 pattern, the ONI's will fall rapidly over the next few months. www.sws.bom.gov.au/Solar/1/6 |
|
|
|
Post by acidohm on May 22, 2019 19:01:59 GMT
Anthony, the Australian BOM says the solar minimum likely occurred in March. NOAA's ENSO prediction record is poor. It's looking like your prediction that the El Nino will end in mid-2019 is proving to be accurate. If 2019 follows the 2010 pattern as you predicted and the 1998 pattern, the ONI's will fall rapidly over the next few months. www.sws.bom.gov.au/Solar/1/6Seems a bit early to be calling minimum?? Cycle 25 spots are very rare right now, much of the uptick in recent value is due to one stubborn 24 spot lasting multiple rotations.... |
|
|
|
Post by missouriboy on May 23, 2019 19:20:07 GMT
Anthony, the Australian BOM says the solar minimum likely occurred in March. NOAA's ENSO prediction record is poor. It's looking like your prediction that the El Nino will end in mid-2019 is proving to be accurate. If 2019 follows the 2010 pattern as you predicted and the 1998 pattern, the ONI's will fall rapidly over the next few months. www.sws.bom.gov.au/Solar/1/6Seems a bit early to be calling minimum?? Cycle 25 spots are very rare right now, much of the uptick in recent value is due to one stubborn 24 spot lasting multiple rotations.... Where are you getting SC24-SC25 sunspot classification info? |
|
|
|
ENSO-2019
May 23, 2019 19:30:48 GMT
via mobile
Post by acidohm on May 23, 2019 19:30:48 GMT
Seems a bit early to be calling minimum?? Cycle 25 spots are very rare right now, much of the uptick in recent value is due to one stubborn 24 spot lasting multiple rotations.... Where are you getting SC24-SC25 sunspot classification info? Ummmmm....not sure! Spaceweather maybe?? Tho position could be a clue, 24 spots likely near equator, 25 likely nearer poles.... |
|
|
|
ENSO-2019
May 23, 2019 19:34:16 GMT
via mobile
Post by acidohm on May 23, 2019 19:34:16 GMT
Im just going to post graphics via twitter, simple.
|
|
|
|
Post by duwayne on May 24, 2019 19:39:02 GMT
Where are you getting SC24-SC25 sunspot classification info? Ummmmm....not sure! Spaceweather maybe?? Tho position could be a clue, 24 spots likely near equator, 25 likely nearer poles.... This "Butterfly Diagram" of sunspots is from February 2019.
users.telenet.be/j.janssens/SC24web/SC24.html#LatitudeThere is only one recent sunspot in the sun's southern hemisphere which is far enough from the equator (lower right-hand corner) to be a Cycle 25. I don't believe there have been any Cycle 25 spots since the date of the graph based upon my recollection of the daily reports from Spaceweather.com . As you can see from the diagram, sunspots in new cycles tend to happen fairly quickly once they begin in earnest although the early ones tend to have a short duration (not shown on the graph). |
|
|
|
ENSO-2019
May 27, 2019 21:49:58 GMT
via mobile
Post by acidohm on May 27, 2019 21:49:58 GMT
|
|
|
|
Post by missouriboy on May 27, 2019 23:36:58 GMT
And if you look at ENSO-MEI data (current), 2015-16 is BELOW 1996-97. Those straight lines disappear. |
|
|
|
Post by duwayne on May 28, 2019 17:49:57 GMT
My understanding is that ONI values (like the ENSO values) are not detrended. Therefore, if the earth warms by 0.3C per 60 years (up 0.6C during the ocean current warming 30 year period and flat during the 30 year cooling period) then there would logically be a long term uptrend in ONIs due to the backgound warming.
|
|
|
|
Post by nautonnier on Jun 2, 2019 22:10:37 GMT
|
|
|
|
Post by nautonnier on Jun 13, 2019 11:40:51 GMT
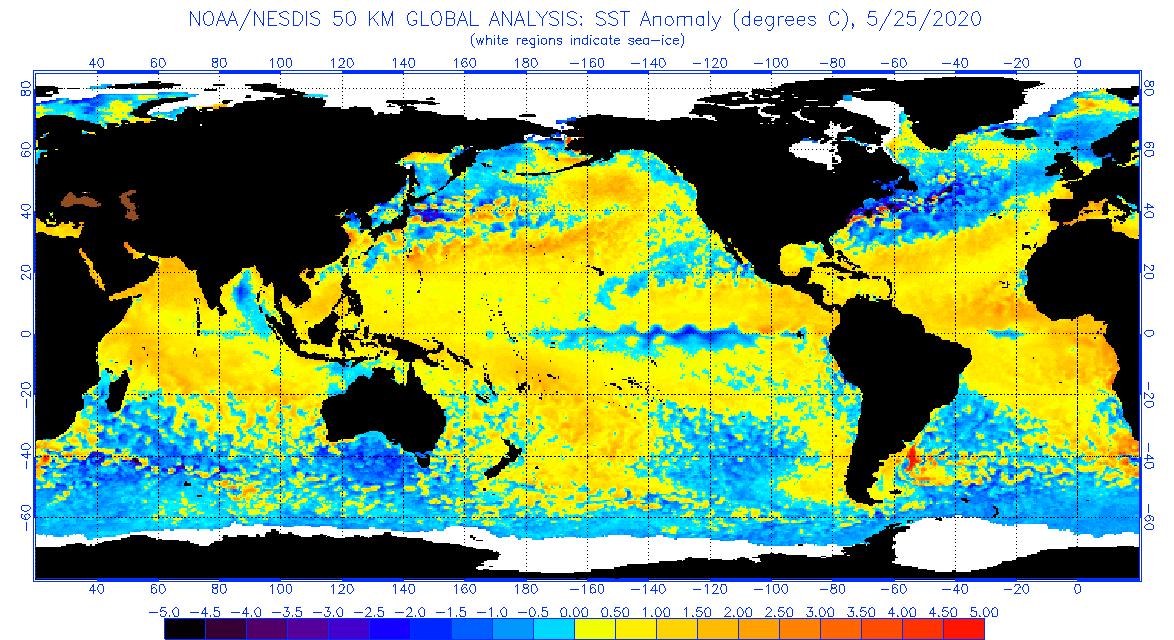 Where are all the 'warm pools'? Northern Hemisphere early summer, Southern Hemisphere early fall, it looks a little cool. |
|
|
|
ENSO-2019
Jun 14, 2019 2:42:26 GMT
via mobile
Post by sigurdur on Jun 14, 2019 2:42:26 GMT
It is.
|
|


