|
|
Post by tobyglyn on Dec 23, 2009 6:01:14 GMT
.......And now that the giant ball of fire in the sky seems to be waking up, we should start seeing a return to CO2-dominated climate behavior, and away from Solar Minimum dominated climate behavior. Or not : "WATERLOO, Ont. (Monday, Dec. 21, 2009) - Cosmic rays and chlorofluorocarbons (CFCs), both already implicated in depleting the Earth’s ozone layer, are also responsible for changes in the global climate, a University of Waterloo scientist reports in a new peer-reviewed paper. In his paper, Qing-Bin Lu, a professor of physics and astronomy, shows how CFCs – compounds once widely used as refrigerants – and cosmic rays – energy particles originating in outer space – are mostly to blame for climate change, rather than carbon dioxide (CO2) emissions. His paper, derived from observations of satellite, ground-based and balloon measurements as well as an innovative use of an established mechanism, was published online in the prestigious journal Physics Reports. “My findings do not agree with the climate models that conventionally thought that greenhouse gases, mainly CO2, are the major culprits for the global warming seen in the late 20th century,” Lu said. “Instead, the observed data show that CFCs conspiring with cosmic rays most likely caused both the Antarctic ozone hole and global warming. These findings are totally unexpected and striking, as I was focused on studying the mechanism for the formation of the ozone hole, rather than global warming.” His conclusions are based on observations that from 1950 up to now, the climate in the Arctic and Antarctic atmospheres has been completely controlled by CFCs and cosmic rays, with no CO2 impact. wattsupwiththat.com/2009/12/22/study-shows-cfcs-cosmic-rays-major-culprits-for-global-warming/#more-14426" |
|
|
|
Post by hilbert on Dec 23, 2009 6:34:16 GMT
 A precursor for ice growth rate? |
|
|
|
Post by stranger on Dec 23, 2009 21:12:22 GMT
Not, indeed. The climate will continue to cool at least until the solar magnetic field intensifies and the GCR's abate. If we are lucky that will be a half a century or so. If not it could be a half million years. The abstract of Dr. Quing's paper is here, tinyurl.com/yaz52brAnd a review of the paper is at insciences.org, here: insciences.org/article.php?article_id=8012It is an interesting read. Stranger |
|
|
|
Post by jorgekafkazar on Dec 24, 2009 5:53:29 GMT
.......And now that the giant ball of fire in the sky seems to be waking up, we should start seeing a return to CO2-dominated climate behavior, and away from Solar Minimum dominated climate behavior. Or not : "WATERLOO, Ont. (Monday, Dec. 21, 2009) - Cosmic rays and chlorofluorocarbons (CFCs), both already implicated in depleting the Earth’s ozone layer, are also responsible for changes in the global climate, a University of Waterloo scientist reports in a new peer-reviewed paper. In his paper, Qing-Bin Lu, a professor of physics and astronomy, shows how CFCs – compounds once widely used as refrigerants – and cosmic rays – energy particles originating in outer space – are mostly to blame for climate change, rather than carbon dioxide (CO2) emissions. His paper, derived from observations of satellite, ground-based and balloon measurements as well as an innovative use of an established mechanism, was published online in the prestigious journal Physics Reports. “My findings do not agree with the climate models that conventionally thought that greenhouse gases, mainly CO2, are the major culprits for the global warming seen in the late 20th century,” Lu said. “Instead, the observed data show that CFCs conspiring with cosmic rays most likely caused both the Antarctic ozone hole and global warming. These findings are totally unexpected and striking, as I was focused on studying the mechanism for the formation of the ozone hole, rather than global warming.” His conclusions are based on observations that from 1950 up to now, the climate in the Arctic and Antarctic atmospheres has been completely controlled by CFCs and cosmic rays, with no CO2 impact. wattsupwiththat.com/2009/12/22/study-shows-cfcs-cosmic-rays-major-culprits-for-global-warming/#more-14426"From what I've seen of Lu's paper, it seems to consist largely of wiggle-matching over a relatively short timespan (or inverse wiggle matching.) Wiggle matching isn't correlation; correlation isn't causation. I'm skeptical. |
|
|
|
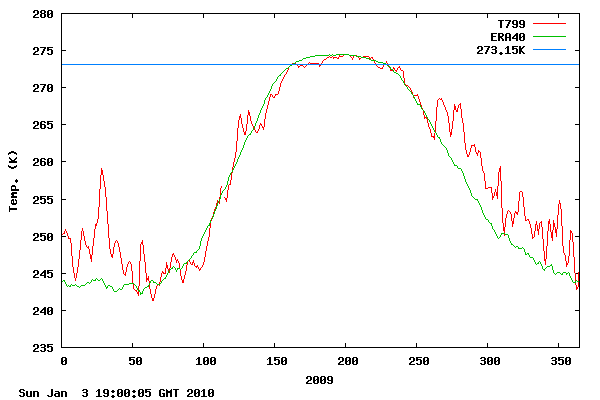
Post by kiwistonewall on Dec 28, 2009 5:21:52 GMT
My last chart for 2009 (I'll move to the 2010 thread) Only 2002,2003 & 2004 are higher as at 27th. 15 day smoothed growth is currently 68427 sq kms/day which is the highest for this date over all years 2002-2008. 1979-2000 mean growth at this time is just over 50000 sq kms/day Growth is usually slow in late December, as the ice growth is now well outside the inner arctic region, and pushing into the far North Atlantic & Pacific regions. Attachments:
|
|
|
|
Post by trbixler on Dec 28, 2009 6:57:52 GMT
Thanks Kiwi and a Happy New Year
|
|
|
|
Post by aj1983 on Dec 29, 2009 14:15:52 GMT
Nice graphs indeed, but I can't help seeing that the ice is well below average, and almost equal to the years with least ice. Rapid growth is probably to catch up to a more average value of the last few years. Ice variations are large however, and in March we could also have an above normal ice year.
|
|
|
|
Post by nautonnier on Dec 29, 2009 16:00:03 GMT
Nice graphs indeed, but I can't help seeing that the ice is well below average, and almost equal to the years with least ice. Rapid growth is probably to catch up to a more average value of the last few years. Ice variations are large however, and in March we could also have an above normal ice year. AJ you should compare these graphs to the similar detailed graphs of the Arctic ice in 1920 - 1930. |
|
|
|
Post by dwerth on Dec 30, 2009 0:30:01 GMT
AJ1983-
Please remember that the IJIS data says itself that it under reports the ice extent, by up to 1 million km2.
|
|
|
|
Post by toughluck on Dec 30, 2009 12:34:11 GMT
AJ1983- Please remember that the IJIS data says itself that it under reports the ice extent, by up to 1 million km2. That should not matter as far as trends go, as long as the average data was done withe the same equipment and algorithms. Pardon my ignorance.. are you saying that the 1971-2000 mean was obtained from a different methodology? (not the JAXA satellite?) |
|
|
|
Post by nautonnier on Dec 30, 2009 13:05:14 GMT
AJ1983- Please remember that the IJIS data says itself that it under reports the ice extent, by up to 1 million km2. That should not matter as far as trends go, as long as the average data was done withe the same equipment and algorithms. Pardon my ignorance.. are you saying that the 1971-2000 mean was obtained from a different methodology? (not the JAXA satellite?) Why is the 1979-2000 'mean' thought to represent anything? Its as meaningless as the Dec 29, 2009 11:12 and 45 seconds to Dec 29, 2009 11:12 and 52 seconds 'mean' for the sea tide level at Grimsby. At 11:13 and 5 seconds the level has a -2.01mm anomaly !! ITS TRENDING DOWN!!! No boats will be able to enter the harbour tomorrow!!  Cycles many be hundreds even thousands of years long in the Arctic - no-one knows what 'normal' is, or even if any sea ice state can be considered normal. Like the tides - what is the normal tide level? You have to be able to measure the full cycles before you can claim you have any knowledge of 'normal' - which you need before you can talk of an anomaly. We have only had satellite measures (inaccurate ones) for 3 decades all the historic anecdotal evidence is discarded and extremely brief 'satellite era evidence' is the ONLY evidence used on which to base these trend forecasts. Its not a particularly scientific approach. |
|
|
|
Post by dwerth on Dec 30, 2009 15:13:05 GMT
Toughluck - yes, the current data is collected differently than the prior '79-'00 mean. The JAXA satellite was launched mid-2002 iirc.
Nautonnier -
I am not sure that it gives us anything other than a period of time to gauge further movements off of. Thats about it. We know that the polar ice caps have fluctuated greatly over geological history, this is just a measurement of it at one point in time. I am most assureadly not making any statements as to the "good" or "bad" ice extent.
|
|
|
|
Post by kiwistonewall on Dec 30, 2009 19:21:09 GMT
The "79-2000" mean on my Jaxa charts was calculated by me by adjusting the Goddard series (that ran from 1979 to 2008- when the satellites finally packed up) using the overlap period 2002-2008 between the two series to create an adjustment matrix.
But even the Goddard series was created with several generations of satellites, and the data has been "improved" over time.
Still, its the best with got. like the CRU temperature records! ;D
|
|
|
|
Post by nautonnier on Dec 31, 2009 9:40:48 GMT
Its just that people start talking of 'normal' when what they actually mean is a snap shot of ~25 years of a variable of unknown variability.
In the medieval warm period or the Roman Optimum perhaps there was no Arctic ice no-one knows. Perhaps no Arctic ice is actually the normal in the Holocene.
So what does the current 'baseline' prove?
|
|
|
|
Post by stranger on Dec 31, 2009 21:19:02 GMT
Good point, Nautonnier. We do NOT know what the arctic was like during the Classic, or Medieval warming periods. Much less the even warmer warming periods before those.
Besides proxies, all we have are legends, stories, collective memories, all fleshed out with speculation. For example, the Australian native peoples have a legend that exactly "40,000 years ago, it was a days walk from the site of the present Sydney Opera House to the sea." How true is that?
We do not KNOW it is true at all. How POSSIBLE is that? If you give up the precise dating, it is quite possible. We know that the sea level was much lower some tens of thousands of years ago - but exactly four ten thousands we do not know.
There are other legends - that the Danes made a fall and winter voyage around Greenland early in the 11th Century, for one. Is that possible? In all probability, it is. That warming period was both warmer than the modern warming period has been so far, and certainly lasted longer than the modern period has.
How about the Classic Warming period - when Hadrian was in the wall building business. Check out the recovered clothing from Roman garbage pits - and the letters home for socks. And gambling money, since boys will be boys. Nothing there suggests anything other than a quite mild climate. And some references in the Keltic legends from the period suggest the sea was relatively ice free. As does the vast expanse of arctic and sub-arctic sites in both Europe and North America identified with the Red Ocher peoples in that and the previous warming period.
We do not know what went on during and after past warming periods. But we know it was not nearly warm enough for viniculture when Bede was alive. In fact, post Classic era, we know quite a bit about the climate from contemporary sources, including Bede. Knowledge that is often deliberately ignored by those who claim extensive knowledge of the subject,
Science cannot throw out data like a busy housewife throws out a decade old frock. If it does, it is no longer science. Even the data provided by the old legends can provide a supporting point at times. The data from contemporary observation can be absolutely invaluable.
Stranger
|
|


