|
|
Post by radiant on Aug 6, 2009 21:56:24 GMT
Bremen use the JAXA which: "The AMSR-E results are preliminary because AMSR-E is still in the calibration phase" www.iup.uni-bremen.de/iuppage/psa/2001/amsrop.html!!! And all the other satellites have failed. Comparing AMSRE images with both US Alaskan & Canadian data, it appears that the AMSRE cut off for open water is about 80% ice. This leads to massive low reporting of extent. So Canada is the only reliable source of data. I am not sure where we are going with this stuff now. Obviously all the Satellites have not failed or somebody has a pretty good imagination to come up with this kind of image: modis.gsfc.nasa.gov/gallery/images/image08032009_250m.jpg 3 days ago its shows a small amount of ice on the northern coast of Novaya Zemlya, Northern Russia and some floating ice around N78 If you go to the JAXA image you can see some of the northern coast ice is marked. Personally i am not so much interested in what JAXA says. I am looking at the images i can find and making my own mind up by comparing what i am told with what i think i can see. CIS are publishing plenty of satellite images of Nares strait for example CIS 30 day forcast was out yesterday. Since we were talking about NW passage: ice-glaces.ec.gc.ca/prods/FECN14CWIS/20090805000000_FECN14CWIS_0004503796.txtForecast ice conditions for August 16th to August 31st.
Mean temperatures are forecast to remain above normal over most
Canadian regions but gradually cool to below normal over the Alaskan
Coast during the last half of August. As a result, the ice will melt at
a moderate pace in the Central Arctic region and ice concentrations will
gradually decrease throughout the Arctic. The south-western portion of
the Northwest Passage will be free of ice but the central portion will
remain problematic with open drift concentrations of first-year and old
ice persisting in Larsen Sound.Crop failure in Canada? www.cwb.ca/public/en/newsroom/releases/2009/073009.jspI think 2009 is estimated to be similar to 2007 for grain. 2008 was better. |
|
|
|
Post by bluecon on Aug 7, 2009 0:58:44 GMT
I stand corrected. Must be the half Finnish in me. I didn't realize CIS was using the satellites. CIS actually has boats and planes in the area observing. Western Canada had drought in Alberta and to much rain in Manitoba and cold all over Canada except the West Coast. The corn around here is way behind schedule and it doesn't like these way below normal temps. We just had the coolest July on record although the media is silent on that. The US Midwest is likely to get a poor corn and soybean crop and that dwarfs all of Canada's agriculture. Actually been quite a cold start to the month of August in the NW Passage after a July that was much colder than the last two years. Sachs Harbour going down to zero C. www.weatheroffice.gc.ca/city/pages/nt-19_metric_e.htmlCanadian temperatures here. www.weatheroffice.gc.ca/canada_e.html |
|
|
|
Post by walterdnes on Aug 7, 2009 5:03:40 GMT
|
|
|
|
Post by walterdnes on Aug 7, 2009 5:46:12 GMT
A couple of good days for arctic sea-ice extent... - August 5th, 2009 JAXA extent has climbed 12,343 km2 above same date 2005
- August 6th, 2009 JAXA extent (interim data) has climbed 65,156 km2 above same date 2008. Interim data is released just after 0300Z, final data just after 1400Z
Coming in above 2005 for the September minimum, especially in the teeth of an El Nino, should "cool off" some of the warm mongers. |
|
|
|
Post by neilhamp on Aug 7, 2009 6:27:44 GMT
I see Joe Romm is changing the basis of discussion. He now claims: -
"Breaking the 2007 sea ice area record seems unlikely, as NSIDC explains in their update. But breaking the 2008 sea ice volume record is still a serious possibility"
If the 2009 sea ice extent "recovery" does materialize volume records will be talked about come September.
|
|
|
|
Post by radiant on Aug 7, 2009 20:14:52 GMT
latest web cam image from north pole shows good ice with no obvious changes since july 29th www.arctic.noaa.gov/latest/noaa1.jpgLast reported position was 85 -02, no new temperature or position data showing so far.  |
|
|
|
Post by kiwistonewall on Aug 7, 2009 22:42:22 GMT
Hi Radiant - I was referring to the Ice Radar satellite sensor failures.
(Sorry for the rather sweeping statement)
We still get IR & Vis photos.
If you check back over the last year or so, you'll see that the SSMI (or whatever letters they used) radar sensors failed. That data series is the long term historic one.
The AMSRE series used different sensors and algorithms, and (according to the Report at Bremen) is uncalibrated.
The reality is that we no longer have any comparable data records of ice extent.
It is possible to measure the ice. Canada does it. Alaska does it. The Climate Scientists don't any more. They have uncalibrated, estimates which I suspect are produced by a computer model given the lack of anything real to base their numbers on.
|
|
|
|
Post by radiant on Aug 8, 2009 4:49:58 GMT
Hi Radiant - I was referring to the Ice Radar satellite sensor failures. (Sorry for the rather sweeping statement) We still get IR & Vis photos. If you check back over the last year or so, you'll see that the SSMI (or whatever letters they used) radar sensors failed. That data series is the long term historic one. The AMSRE series used different sensors and algorithms, and (according to the Report at Bremen) is uncalibrated. The reality is that we no longer have any comparable data records of ice extent. It is possible to measure the ice. Canada does it. Alaska does it. The Climate Scientists don't any more. They have uncalibrated, estimates which I suspect are produced by a computer model given the lack of anything real to base their numbers on. Either way looking at the melt rate for Hudson Bay via: ice-glaces.ec.gc.ca/Ice_Can/ANIM-CMMBCTCA.gifThere will be very little ice remaining in one weeks time. CIS is saying Hudson bay is later than normal and other areas are ahead of normal. CIS are saying unusual changes are happening in Nares strait and they are forcasting the south western part of the NW passage to be open. And this kind of thing can be observed via the visible satellite data. I found a source for daily satellite MODIS TERRA images by the way of the Western arctic. Not as high resolution as the ones the Danish service is showing but not bad. sv.gina.alaska.edu/ If you press enuf buttons on the java thing that loads you can get it to work quite well  You can see the ice on Hudson bay and get an idea what is going on from for example. T1.09219.1827 Sensor: Terra-1 / Modis 2009-08-07 / 18:27:16 GMT Browse: 20km - 1km If you were looking at a high resolution image of this same area a very good estimation of what is there could be made. Here is the higher resolution july 6th image again modis.gsfc.nasa.gov/gallery/images/image07202009_250m.jpgand here is jaxa for same day: www.ijis.iarc.uaf.edu/cgi-bin/seaice-monitor.cgi?lang=e&mode=img&date=set&y=2009&m=07&d=06 |
|
|
|
Post by jimcripwell on Aug 9, 2009 18:11:24 GMT
I did some more "back of the envelope" calculations. Over the next 20 days, 2008 lost sea ice area at a rate of about 66,000 sq kms per day. Over the last 10 days, 2009 lost sea ice area at the rate of about 49,000 sq kms per day. Assuming this trend continues, by the end of August, 2009 may have about 450,000 sq kms of sea ice area more than 2008.
|
|
mrmga
New Member

Posts: 14
|
Post by mrmga on Aug 9, 2009 19:23:55 GMT
Here's the headline of one of today's Top Stories on Yahoo News (via AP): Vast expanses of Arctic ice melt in summer heat. Here are some choice quotes: "The Arctic Ocean has given up tens of thousands more square miles (square kilometers) of ice in a relentless summer of melt, with scientists watching through satellite eyes for a possible record low polar ice cap.
"Global average temperatures rose 1 degree Fahrenheit (0.6 degree Celsius) in the past century, but Arctic temperatures rose twice as much or even faster, almost certainly in good part because of manmade greenhouse gases, researchers say."And the obligatory reference to polar bears: "Environmentalists worry, for example, that the ice-dependent polar bear will struggle to survive as the Arctic cap melts." news.yahoo.com/s/ap/20090809/ap_on_re_ca/cn_canada_ice_retreatsI'm no expert, but based on what I'm reading on this forum and in the links you folks post, this "Top Story" is pure, unadulterated alarmist propaganda. It's surprising that most people remain skeptical of AGW despite being fed a steady diet of this pap by our top "news" organizations. |
|
|
|
Post by kiwistonewall on Aug 9, 2009 22:27:24 GMT
Based on the math trends, the ice should bottom out late September at a minimum (Jaxa series) of about 5.6 million sq kms. (Fourth lowest after 2007,2008 and 2005) Tho' it wouldn't surprise me if we get more ice than that. 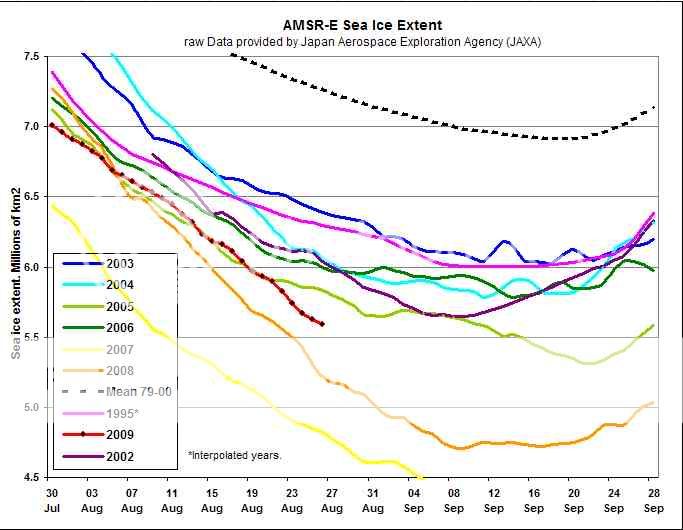 |
|
|
|
Post by msphar on Aug 10, 2009 0:42:09 GMT
That is good news... The four boats I am following are all currently stuck waiting for some ice to clear out of two significant areas in the NW passage. They are sitting twiddling thumbs and trying to keep up the robust front but I know they are gritting their teeth and staring at the Canadian CG daily ice reports and hoping for the hail mary. I write this from the belly of my 40 foot Long Range Cruiser. I'm sure if I was up there I would be wondering what the ice might be able to do to my hull over the course of a winter.
|
|
|
|
Post by bluecon on Aug 10, 2009 2:14:55 GMT
Here's the headline of one of today's Top Stories on Yahoo News (via AP): Vast expanses of Arctic ice melt in summer heat. Here are some choice quotes: "The Arctic Ocean has given up tens of thousands more square miles (square kilometers) of ice in a relentless summer of melt, with scientists watching through satellite eyes for a possible record low polar ice cap.
"Global average temperatures rose 1 degree Fahrenheit (0.6 degree Celsius) in the past century, but Arctic temperatures rose twice as much or even faster, almost certainly in good part because of manmade greenhouse gases, researchers say."And the obligatory reference to polar bears: "Environmentalists worry, for example, that the ice-dependent polar bear will struggle to survive as the Arctic cap melts." news.yahoo.com/s/ap/20090809/ap_on_re_ca/cn_canada_ice_retreatsI'm no expert, but based on what I'm reading on this forum and in the links you folks post, this "Top Story" is pure, unadulterated alarmist propaganda. It's surprising that most people remain skeptical of AGW despite being fed a steady diet of this pap by our top "news" organizations. Such poor journalism. Average temperatures for Tuktoyaktuk degrees C July 2007 12.7 July 2008 13.13 July 2009 8.62 Some warming trend www.climate.weatheroffice.ec.gc.ca/climateData/dailydata_e.html |
|
|
|
Post by sigurdur on Aug 10, 2009 2:43:21 GMT
Here's the headline of one of today's Top Stories on Yahoo News (via AP): Vast expanses of Arctic ice melt in summer heat. Here are some choice quotes: "The Arctic Ocean has given up tens of thousands more square miles (square kilometers) of ice in a relentless summer of melt, with scientists watching through satellite eyes for a possible record low polar ice cap.
"Global average temperatures rose 1 degree Fahrenheit (0.6 degree Celsius) in the past century, but Arctic temperatures rose twice as much or even faster, almost certainly in good part because of manmade greenhouse gases, researchers say."And the obligatory reference to polar bears: "Environmentalists worry, for example, that the ice-dependent polar bear will struggle to survive as the Arctic cap melts." news.yahoo.com/s/ap/20090809/ap_on_re_ca/cn_canada_ice_retreatsI'm no expert, but based on what I'm reading on this forum and in the links you folks post, this "Top Story" is pure, unadulterated alarmist propaganda. It's surprising that most people remain skeptical of AGW despite being fed a steady diet of this pap by our top "news" organizations. Such poor journalism. Average temperatures for Tuktoyaktuk degrees C July 2007 12.7 July 2008 13.13 July 2009 8.62 Some warming trend www.climate.weatheroffice.ec.gc.ca/climateData/dailydata_e.htmlBe careful with facts here. The world wide anomaly charts showed that the temp was in the 4-5C warmer than average. At least the ones Socold showed us. Of course, basically the whole of Canada is wayyyyy below averages except for the west coast, which by land mass area is a small percentage. We won't mention the upper midwest of the USA either..or the NE..or....or? |
|
|
|
Post by sigurdur on Aug 10, 2009 2:45:30 GMT
IF the boys in the tinker toy boats wanted to really make a statement, they should be sailing the northern route of the NW passage, as that is the only route commercial vessels could use.
I wonder why on earth they aren't taking the actual route that would be used by commercial vessels?
|
|


