|
|
Post by sigurdur on Aug 13, 2009 13:33:29 GMT
I don't think any credible climate scientist will defend Mann's paper where he exibited the hockey stick graph. IT is not even used in literature anymore it was that bad. But one paper does not make all papers bad. The sad thing is Mann still tries to defend his graph. IF he doesn't know full well that it is not credible, then he is really beyond hope for any kind of climate discussion for I would say that even I, who know virtually nothing, would know more than he does. OR at least my nose works, and a skunk still smells like a skunk. As far as I know over at Climate Audit they are still fighting the hockey stick theory as the hockey stick proponrnets came up with new evidence. Of course it is nonsense, that won't stop the AGW believers from using it. I am not so sure that the IPCC has entirely dropped it. That paper was such junk science that it isn't worth the time to refute anymore. If someone wants to shut their brain down to believe it, we can't help them. |
|
|
|
Post by dopeydog on Aug 13, 2009 15:24:01 GMT
If you go through AR4 from the IPCC, you will see that they have adjusted all the scales on their graphs to make the plots all look like an angle brackets. The y distance is equal to the x distance on the graphs. I was a management consultant once and I would have gotten fired for doing graphs like that.
|
|
|
|
Post by steve on Aug 13, 2009 15:54:04 GMT
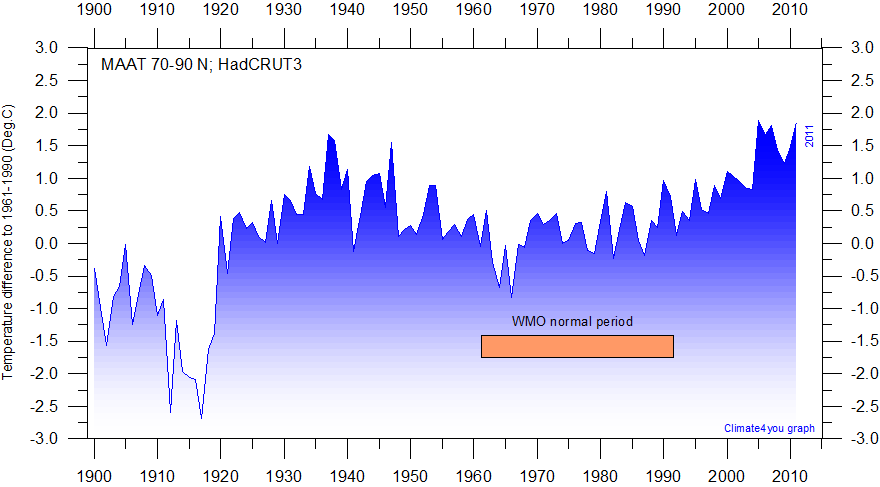
There is a huge amount of evidence from the Thirties and Forties that it warmer than now. The scientists delibaretly ignore the actual evidence so they can prop up their AGW scamNo - there is evidence that the arctic was in a warm phase of an apparent cycle. There is no evidence that the temperature peak was as high as the current peak. It's unlikely that ice extent was lower in the in 1930s/1940s as temperatures rose from a much lower base than to-day. There is huge amounts of evidence. You are not interested in the truth so I won't bother. Henry Larsen's 1944 trip could not be repeated in the 90's or 2000's. Just one tiny bit . This evidence suggests that the late September journey from Tuktoyaktuk to the Bering strait was far hairier in 1944 than it would have been at the same time of year in the years since 1997. www.ucalgary.ca/arcticexpedition/larsenexpeditionsThis is from 2007: esamultimedia.esa.int/images/EarthObservation/Envisat/Envisat_ASAR_GM_Sep2007_2_passages_and_mask_H1.jpg |
|
|
|
Post by bluecon on Aug 13, 2009 16:05:38 GMT
There was a huge storm which Larsen waited out in Tuk. This may have had much to do with this ice. Larsen went up from Vancouver and down the length of the Southern NW Passage many times. There was a flotilla that left Vancouver every year to supply the outposts in the NW Passage. They also had a boat coming in from the East to supply the outposts. The Hudson Bay Company kept careful temp/weather records some going back hundreds of years. Todays science preffers to ignore these records and fudge the science. |
|
|
|
Post by steve on Aug 13, 2009 19:13:30 GMT
There was a huge storm which Larsen waited out in Tuk. This may have had much to do with this ice. Larsen went up from Vancouver and down the length of the Southern NW Passage many times. There was a flotilla that left Vancouver every year to supply the outposts in the NW Passage. They also had a boat coming in from the East to supply the outposts. The Hudson Bay Company kept careful temp/weather records some going back hundreds of years. Todays science preffers to ignore these records and fudge the science. A Google of "hudson bay company temperature records" seems to pick up quite a lot of research based on these logs. |
|
|
|
Post by icefisher on Aug 13, 2009 19:15:38 GMT
This evidence suggests that the late September journey from Tuktoyaktuk to the Bering strait was far hairier in 1944 than it would have been at the same time of year in the years since 1997. The big difference between then and now is the availability of information to mariners, safety equipment, and small vessel construction. Arctic NW passage transits took off in 1975 with the launching of the two global forecasting satellites. Up until then there had been all of 11 transits. In 1975-79 there were 9 transits. One cannot compare the risks before and after as its night vs day. |
|
|
|
Post by jurinko on Aug 13, 2009 21:41:16 GMT
|
|
|
|
Post by radiant on Aug 13, 2009 21:54:43 GMT
|
|
|
|
Post by steve on Aug 14, 2009 8:41:47 GMT
This evidence suggests that the late September journey from Tuktoyaktuk to the Bering strait was far hairier in 1944 than it would have been at the same time of year in the years since 1997. The big difference between then and now is the availability of information to mariners, safety equipment, and small vessel construction. Arctic NW passage transits took off in 1975 with the launching of the two global forecasting satellites. Up until then there had been all of 11 transits. In 1975-79 there were 9 transits. One cannot compare the risks before and after as its night vs day. I understand that. You're hardly going to make a successful transit in any climate if you use the Hudson Bay route via Repulse Bay! I provided the documentary evidence because it contrasted the low ice conditions in the passage with the higher ice conditions in the Beaufort and Chuckchi seas. So the successful passage in 1944 is not hard evidence that ice extent then were as low as now. It is good evidence that the mere ability to make the passage more frequently now is not good evidence that ice conditions now are more benign. |
|
|
|
Post by radiant on Aug 14, 2009 9:05:54 GMT
The big difference between then and now is the availability of information to mariners, safety equipment, and small vessel construction. Arctic NW passage transits took off in 1975 with the launching of the two global forecasting satellites. Up until then there had been all of 11 transits. In 1975-79 there were 9 transits. One cannot compare the risks before and after as its night vs day. I understand that. You're hardly going to make a successful transit in any climate if you use the Hudson Bay route via Repulse Bay! I provided the documentary evidence because it contrasted the low ice conditions in the passage with the higher ice conditions in the Beaufort and Chuckchi seas. So the successful passage in 1944 is not hard evidence that ice extent then were as low as now. It is good evidence that the mere ability to make the passage more frequently now is not good evidence that ice conditions now are more benign. All we seem to know is that is when he got to Tuk there was a massive storm and from that point onwards it was a race against time to get to the open seas before the freeze up while ice threatened the boat. It could have been true he could have sailed right around it with the benefit of an on board satellite link. If you look at the route to the pacific today the ice is very close to it being possible it could close off the route to the pacific at any moment. But what we do know from other evidences in that the ice melt from the 1920 till 1940's was the greatest of the 20th century prior to at least 1988 and from the 1950's until the maximum extent for this mini cooling period the ice grew again till 1973. And all of this warming and cooling was going on in an overall warming period that seems to have begun around 1800 or so. However it is also true that: www.vancouvermaritimemuseum.com/page216.htmHenry Larsen, born in Norway in 1899, set about building a career path to realize his dream – to sail the Northwest Passage. At the age of 15 he went to sea aboard a square-rigger and later served his compulsory two years with the Norwegian navy. After spending two years in the Arctic aboard an American trading schooner, Larsen made a life altering decision. In 1924 he applied and received Canadian citizenship and joined the RCMP becoming first mate on the newly christened St Roch. Henry Larson: 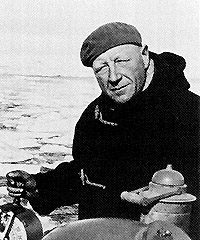 Roald Amundsen: 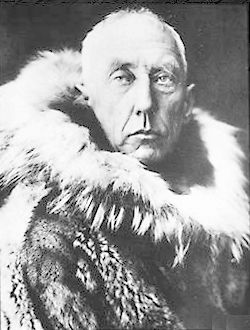 Interestingly Roald Amundsen set sail for the Pacific from Gjoa Haven on 13th of August 1905 and was already with a US whaler on 26th of August 1905 - probably well inside arctic waters. Larsen reached the Pacific almost exactly one month after that date on 27th of September 1944 Epic stories to one side the 2007 Barrow web cam shows no sea ice freeze before Nov 2007 www.gi.alaska.edu/snowice/sea-lake-ice/images/Barrow_webcam/brw_webcam06_07season.mp4The record though suggests warming thru to the 1950's |
|
|
|
Post by woodstove on Aug 14, 2009 12:49:22 GMT
The big difference between then and now is the availability of information to mariners, safety equipment, and small vessel construction. Arctic NW passage transits took off in 1975 with the launching of the two global forecasting satellites. Up until then there had been all of 11 transits. In 1975-79 there were 9 transits. One cannot compare the risks before and after as its night vs day. I understand that. You're hardly going to make a successful transit in any climate if you use the Hudson Bay route via Repulse Bay! I provided the documentary evidence because it contrasted the low ice conditions in the passage with the higher ice conditions in the Beaufort and Chuckchi seas. So the successful passage in 1944 is not hard evidence that ice extent then were as low as now. It is good evidence that the mere ability to make the passage more frequently now is not good evidence that ice conditions now are more benign. Talk about the Norse colony on Greenland from 1000 to 1350, Steve. Your spin will be something to see I'm sure. |
|
|
|
Post by sigurdur on Aug 14, 2009 12:59:14 GMT
I understand that. You're hardly going to make a successful transit in any climate if you use the Hudson Bay route via Repulse Bay! I provided the documentary evidence because it contrasted the low ice conditions in the passage with the higher ice conditions in the Beaufort and Chuckchi seas. So the successful passage in 1944 is not hard evidence that ice extent then were as low as now. It is good evidence that the mere ability to make the passage more frequently now is not good evidence that ice conditions now are more benign. Talk about the Norse colony on Greenland from 1000 to 1350, Steve. Your spin will be something to see I'm sure. Past Actic Ice events have been cyclical in nature, just as the current decline/beginning of increase are cyclical in nature. IT isn't how much ice there is now, verses the ice 30 years ago. That in and off itself is a strawman arguement. What is interesting is with the tech we have now to watch the ice ebb and flow. No one with an ounce of intelligence would use Arctic Ice as any basis for AGW as that has been shown over and over and over to be a hollow arguement. |
|
jtom
Level 3 Rank

Posts: 248
|
Post by jtom on Aug 14, 2009 17:31:17 GMT
|
|
|
|
Post by nautonnier on Aug 14, 2009 18:11:20 GMT
|
|
|
|
Post by poitsplace on Aug 14, 2009 19:11:42 GMT
Nah, it's perfectly normal. You'll notice the same artifact in the other years, just at a different time. It just means it's likely the level will bottom out at a level roughly proportional to that artifact. Probably between 4.5 and 5 on ice area and a little above or below 6 on the ice extent. Most likely we're looking at year 3 of the arctic recovery...much to the disappointment of the alarmists. |
|


 ) says Greenland ice reached max extent around 1800 with extensive written records to support the scientific evidence and although there were periods of advancement the trend was towards melting with reactivation of ice fronts at 1880 to 1890, stabilisation around 1915-1925 and most rapid retreat of the 20th century from 1920's to 1940's as of 1988.

