|
|
Post by magellan on Feb 11, 2009 23:33:11 GMT
|
|
|
|
Post by socold on Feb 12, 2009 19:07:09 GMT
There's plenty of empirical evidence.
-Satellites, not affected by UHI, show the same amount of warming.
-The oceans are also warming, again they are not affected by UHI.
-Rural locations show as much warming as urban, indicating again that the records here are not affected by UHI.
-The pattern of warming around the world does not match urban development. Ie the arctic shows greater warming than some urban locations in the US. If the record was heavily affected by UHI the reverse would be expected.
The media article you link to doesn't seem to have any relevance to warming trends, only warm events. yes UHI exists in the raw temperature data, but there's good empirical evidence that it's corrected for in the temperature records.
|
|
|
|
Post by kiwistonewall on Feb 12, 2009 21:31:42 GMT
Socold
"Rural locations show as much warming as urban" is patently false as has been proved over & over again. Every rural data set I have examined shows slight cooling from the 50's to present.
The USA from the Rockies to the Appalachians has no warming and the grain belt has been published as having no warming.
Evidence for the UHI effect in the CET series is well documented.
You are then just spouting propaganda- so you are just damaging your own credibility.
|
|
|
|
Post by socold on Feb 13, 2009 0:07:26 GMT
Socold "Rural locations show as much warming as urban" is patently false as has been proved over & over again. Every rural data set I have examined shows slight cooling from the 50's to present. How many rural datasets you have exaimined? Irrelevant. Whether or not these regions show warming has no bearing on UHI affecting the records. I know nothing of this. Nope, I am aware of a few studies that have compared urban and rural stations and thier trends. These all show rural warming matches urban warming. Eg: www.agu.org/pubs/crossref/2008/2008JD009916.shtmlpubs.giss.nasa.gov/docs/2001/2001_Hansen_etal.pdfIf it could be shown that rural stations show far less warming than urban stations, skeptics would have a field day pointing that out. So can you direct me to a blog where they have compared the rural trends with the urban trends? If this hasn't been done, I would not be too suprised because I suspect it hasn't been done becuase it doesn't yeild the wanted results. Also you didn't address the satellite records showing warming too, or the oceans showing warming. Remote areas such as the antarctic peninsular (hardly urban) and arctic show warming. All of the empirical evidence points strongly against the idea that the surface records show too much warming because of UHI. In fact if you read the opening post and link carefully you will note that it merely points out that UHI exists and doesn't provide any evidence that it affects the surface temperature record trends. This constant attack on the surface records, followed by a quiet withdrawal for a month or so only to have another stab at it is getting tiring. Either someone explain how all these inconsistancies (satellite warming, ocean warming, etc) can make sense alongside the UHI claims or stop making them. |
|
|
|
Post by magellan on Feb 13, 2009 0:40:53 GMT
Socold "Rural locations show as much warming as urban" is patently false as has been proved over & over again. Every rural data set I have examined shows slight cooling from the 50's to present. How many rural datasets you have exaimined? Irrelevant. Whether or not these regions show warming has no bearing on UHI affecting the records. I know nothing of this. Nope, I am aware of a few studies that have compared urban and rural stations and thier trends. These all show rural warming matches urban warming. Eg: www.agu.org/pubs/crossref/2008/2008JD009916.shtmlpubs.giss.nasa.gov/docs/2001/2001_Hansen_etal.pdfIf it could be shown that rural stations show far less warming than urban stations, skeptics would have a field day pointing that out. So can you direct me to a blog where they have compared the rural trends with the urban trends? If this hasn't been done, I would not be too suprised because I suspect it hasn't been done becuase it doesn't yeild the wanted results. Also you didn't address the satellite records showing warming too, or the oceans showing warming. Remote areas such as the antarctic peninsular (hardly urban) and arctic show warming. All of the empirical evidence points strongly against the idea that the surface records show too much warming because of UHI. In fact if you read the opening post and link carefully you will note that it merely points out that UHI exists and doesn't provide any evidence that it affects the surface temperature record trends. This constant attack on the surface records, followed by a quiet withdrawal for a month or so only to have another stab at it is getting tiring. Either someone explain how all these inconsistancies (satellite warming, ocean warming, etc) can make sense alongside the UHI claims or stop making them. Why do you continue to promote junk science "research" that is not based on actual empirical data? Um, if you'd care to notice, the 30 year trend for UAH is less than GISS or Hadley. RSS is stubbornly incrementally dropping theirs closer to UAH. There is still a step function in their data from the early 1990's even Tamino has acknowledged. Do you have just one study that uses empirical data rather than lights=0 Hansen interpretation (assumptions) of what is rural and what is urban? NO YOU DO NOT. Referring to the second paper you referenced, how do you suppose Hansen, with the "help" from Tom Karl, arrived at their "adjustment" to U.S. temperatures? After Hansen's Y2K error was exposed, it didn't take but a few months before GISS "adjusted" U.S. temperatures back up to equal the 1930's, then later it magically rose above.   I have no less than 20 studies concerning UHI using actual measured data comparisons in each respective location. You on the other hand continue regurgitating the same pap masquerading as science by pro-AGW zealots who always find ways using creative yet untested methods to support their advocacy positions. |
|
|
|
Post by ron on Feb 13, 2009 0:45:37 GMT
Do you have a version of that graphic that includes the last 8 years, by any chance?
|
|
|
|
Post by magellan on Feb 13, 2009 1:10:10 GMT
Do you have a version of that graphic that includes the last 8 years, by any chance? Unfortunately the way GIStemp data is formatted, it is a pain to collate. I created an Excel macro to do it, but then discovered GIStemp data changes every month throughout the record. Nobody can figure out the algorithm mess Hansen calls a program. I'm sure one is available at CA, but due to monthly data adjustments, it is impossible to post a graph from GISStemp and expect it to match the previous month. Oh, and they do not archive the adjustments, nor explain them. To see how Hansen, and subsequently the "studies" we keep seeing stating UHI "doesn't matter" or it is "accounted for", an example is given here: wattsupwiththat.com/?s=lights%3D0and here www.climateaudit.org/?p=1620That's what is meant by 'lights = 0'. I should also mention Tom Karl is (or was) the overseer of these stations and mentored Hansen on the finer qualities of data "adjustment". Note the carefully crafted methods to address microsite issues as well. |
|
|
|
Post by icefisher on Feb 13, 2009 1:21:23 GMT
Do you have a version of that graphic that includes the last 8 years, by any chance? Unfortunately the way GIStemp data is formatted, it is a pain to collate. I created an Excel macro to do it, but then discovered GIStemp data changes every month throughout the record. Nobody can figure out the algorithm mess Hansen calls a program. I'm sure one is available at CA, but due to monthly data adjustments, it is impossible to post a graph from GISStemp and expect it to match the previous month. Oh, and they do not archive the adjustments, nor explain them. Uh, if there is no civil disobedience in Hansen's work then he doesn't practice what he preaches. |
|
|
|
Post by socold on Feb 13, 2009 1:34:49 GMT
Um, if you'd care to notice, the 30 year trend for UAH is less than GISS or Hadley. And this difference is where your UHI effect must lie. Lets see how big that difference is: 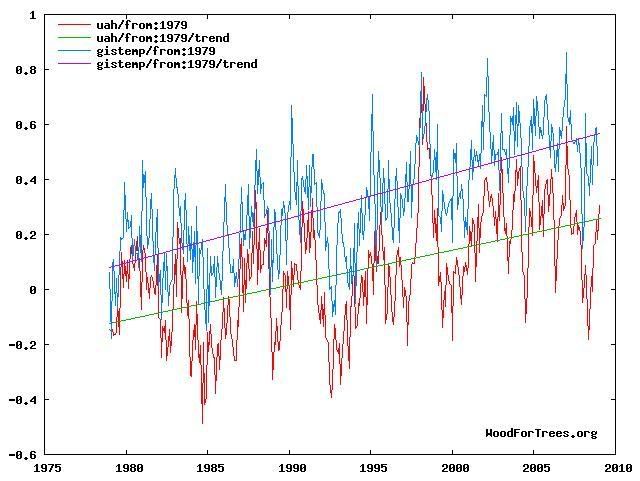 The difference in question is the difference in angle between those two linear trends. There's not much room for a revelation there. Even if GISTEMP is wrong, there's still strong warming in the past 30 years. Considering that UHI is not even the full difference between those two lines (assuming you want to spare some to attribute to "Hansen Fiddling" and some more to attribute to microsite biases), it seems UHI cannot have caused much of the last 30 year warming trend at all. As for conspiracy theories about Hansen fiddling the data: From the above graph I fail to see exactly what he would have achieved even if he had converted the lower trend into the higher trend. Sure it shows more warming, but what qualative argument can be advanced with the higher trend that cannot be advanced with the lower one? As far as I am concerned, lets use UAH as the record for the surface warming over the past 30 years without UHI interference. If that knocks out these silly claims about Hansen and UHI then I would be fine with that. UAH have brought theirs up far more than RSS have brought theirs down. Back in 2000 UAH didn't even show any warming until it was corrected. I don't really care what Tamino has acknowledged, if there was an obvious error it would be corrected. As it stands today there is as big a difference between RSS and UAH over the past 30 years as between GISTEMP and UAH: 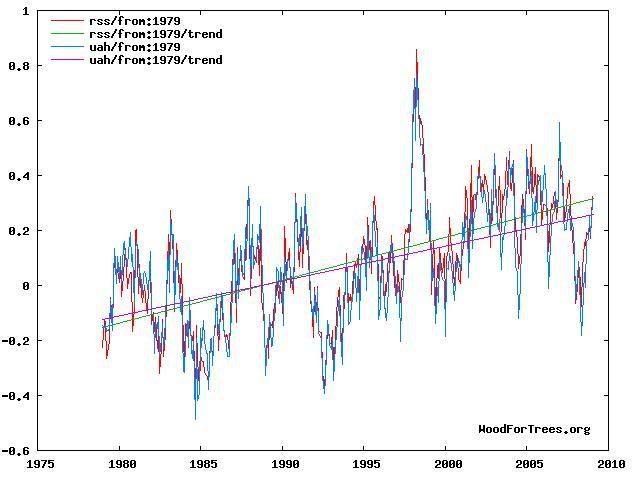 I don't find this difference particularly significant though. I am no more banking on RSS than UAH. The actual trend could be at either line, or inbetween for all I care. That study did use empirical data... I already linked to it. Where is yours though? Where is the analysis which takes the GISTEMP record or the HadCrut one and shows that rural stations have significantly less warming than urban stations? Such records change all the time. Simply telling me that they changed is neither a suprise for me, nor an argument. The problem phrase there is respective location. It implies these studies only focus in on one location at a time and don't look at the entire overall picture. If you want to show the surface records have a UHI bias you have to show it by taking a large sample from the records and show a statistically significant bias. Ie you have to show that areas that are more heavily subject to urban heat island are more likely to show more warming than areas less subject to it. That would do it. The study I linked to attempted to make this comparison and found very little UHI bias. Until someone does a study that shows that's wrong, I stand by that. |
|
|
|
Post by magellan on Feb 13, 2009 3:17:42 GMT
And this difference is where your UHI effect must lie. Lets see how big that difference is: The difference in question is the difference in angle between those two linear trends. There's not much room for a revelation there. Even if GISTEMP is wrong, there's still strong warming in the past 30 years. Considering that UHI is not even the full difference between those two lines (assuming you want to spare some to attribute to "Hansen Fiddling" and some more to attribute to microsite biases), it seems UHI cannot have caused much of the last 30 year warming trend at all. As for conspiracy theories about Hansen fiddling the data: From the above graph I fail to see exactly what he would have achieved even if he had converted the lower trend into the higher trend. Sure it shows more warming, but what qualative argument can be advanced with the higher trend that cannot be advanced with the lower one? As far as I am concerned, lets use UAH as the record for the surface warming over the past 30 years without UHI interference. If that knocks out these silly claims about Hansen and UHI then I would be fine with that. UAH have brought theirs up far more than RSS have brought theirs down. Back in 2000 UAH didn't even show any warming until it was corrected. I don't really care what Tamino has acknowledged, if there was an obvious error it would be corrected. As it stands today there is as big a difference between RSS and UAH over the past 30 years as between GISTEMP and UAH: I don't find this difference particularly significant though. I am no more banking on RSS than UAH. The actual trend could be at either line, or inbetween for all I care. That study did use empirical data... I already linked to it. Where is yours though? Where is the analysis which takes the GISTEMP record or the HadCrut one and shows that rural stations have significantly less warming than urban stations? Such records change all the time. Simply telling me that they changed is neither a suprise for me, nor an argument. The problem phrase there is respective location. It implies these studies only focus in on one location at a time and don't look at the entire overall picture. If you want to show the surface records have a UHI bias you have to show it by taking a large sample from the records and show a statistically significant bias. Ie you have to show that areas that are more heavily subject to urban heat island are more likely to show more warming than areas less subject to it. That would do it. The study I linked to attempted to make this comparison and found very little UHI bias. Until someone does a study that shows that's wrong, I stand by that. The study I linked to attempted to make this comparison and found very little UHI bias. The study you linked to did not examine any sites or perform any type of experiment, nor is there any Quality Control performed. em·pir·i·cal (m-pîr-kl) adj. 1. a. Relying on or derived from observation or experiment: empirical results that supported the hypothesis. b. Verifiable or provable by means of observation or experiment: empirical laws. 2. Guided by practical experience and not theory, especially in medicine. That said: Quantifying the influence of anthropogenic surface processes and inhomogeneities on gridded global climate data www.uoguelph.ca/~rmckitri/research/jgr07/M&M.JGRDec07.pdf[/b][/quote] So it is your contention that Los Angeles, Singapore, Melbourne, Osaka and many, many others including an entire state (Florida) are mere anomalies and somehow the thousands of other cities and towns of the world are unaffected by urban growth and microsite issues? Spencer and Christy pioneered the MSU global satellite temperature data. It since has gone through growing pains as any new technology does, for which RSS gleaned from. A history of adjustments since 1992:  This is RSS' only documented adjustment on their ftp site. ftp.ssmi.com/msu/readme_jan_2008.txtThe 1992 step change still exists in the RSS data set as noted in the following, signifying UAH is the more accurate of the two products. I have the full article if you want snippets. www.agu.org/pubs/crossref/2008/2007JD008864.shtmlDiurnal correction signatures still exist in the RSS LT time series and are likely affecting the long-term trend with a warm bias. And Tamino's admission after relentless UAH bashing, then an education from Douglass and Randall: tamino.wordpress.com/2008/10/21/rss-and-uah/Tamino has lost all credibility and is viewed as a tabloid rag. Nice try anyway socold. |
|
|
|
Post by socold on Feb 13, 2009 3:44:01 GMT
The paper I cited analyzed the empirical data (surface temperature data compiled into records) and where urban areas are determined by light again from empirical data.
An analysis which fits: "a. Relying on or derived from observation or experiment: empirical results that supported the hypothesis."
In addition the paper you cite is no more empirical.
And are further based on the assumption that "the spatial pattern of temperature trends in a widely used gridded climate data set is independent of socioeconomic determinants of surface processes and data inhomogeneities" which is obviously not true. More warming is expected over land than ocean, which means more warming in the northern hemisphere, which just happens to be where socioeconomic indicators are higher.
In addition:
"Using the regression model to filter the extraneous, nonclimatic effects reduces the estimated 1980–2002 global average temperature trend over land by about half."
If this were true the UAH record would show more warming than the surface and the oceans would show more warming than the land.
No my contention is that overall such UHI is corrected for sufficiently in the records. Again look at that small space between the UHI record and the GISTEMP record. There's not enough there to argue over is there?
|
|
|
|
Post by socold on Feb 13, 2009 3:46:20 GMT
Lets go back to the top of this thread where it was said:
"Ever notice warmers claim UHI is of no consequence but they never provide empirical evidence?"
At least now I have shown this is wrong. "Warmers" have regularly pointed out why we find UHI of no consequence. it's an entirely empirical argument - the empirical data (satellite, ocean and surface temperature data). Believing there is a significant UHI bias in HadCrut and GISTEMP actually provides more conflicts with the empirical data.
|
|
|
|
Post by magellan on Feb 13, 2009 4:14:28 GMT
Lets go back to the top of this thread where it was said: "Ever notice warmers claim UHI is of no consequence but they never provide empirical evidence?" At least now I have shown this is wrong. "Warmers" have regularly pointed out why we find UHI of no consequence. it's an entirely empirical argument - the empirical data (satellite, ocean and surface temperature data). Believing there is a significant UHI bias in HadCrut and GISTEMP actually provides more conflicts with the empirical data. Read my edits. Here, some spoon feeding: mclean.ch/climate/Melbourne_UHI.htmwww.bca.gov.sg/ResearchInnovation/others/UHI%20_2004-001_%20rev.pdfSo you know, US temps (USHCN) in GIStemp use lights=0 Global (GHCN) use population. < 100,000 is considered "rural". This kind of blows that out of the water: www.geography.uc.edu/~kenhinke/uhi/Hinkel&Nelson_JGR-A_2007.pdfRemove 1/2 the UHI effect from the temperature record trend over land as shown in the M&M paper, and guess which trend set it matches?  |
|
|
|
Post by magellan on Feb 13, 2009 4:20:13 GMT
The paper I cited analyzed the empirical data (surface temperature data compiled into records) and where urban areas are determined by light again from empirical data. An analysis which fits: "a. Relying on or derived from observation or experiment: empirical results that supported the hypothesis." In addition the paper you cite is no more empirical. And are further based on the assumption that "the spatial pattern of temperature trends in a widely used gridded climate data set is independent of socioeconomic determinants of surface processes and data inhomogeneities" which is obviously not true. More warming is expected over land than ocean, which means more warming in the northern hemisphere, which just happens to be where socioeconomic indicators are higher. In addition: "Using the regression model to filter the extraneous, nonclimatic effects reduces the estimated 1980–2002 global average temperature trend over land by about half." If this were true the UAH record would show more warming than the surface and the oceans would show more warming than the land. No my contention is that overall such UHI is corrected for sufficiently in the records. Again look at that small space between the UHI record and the GISTEMP record. There's not enough there to argue over is there? In addition the paper you cite is no more empirical. I never said it was, but if you live by the sword, you die by it. Now, show me where Jones et al examined one of the 289 sites they used in their study for data quality. The reason for surfacestations.org was just for that purpose. Over 60% of those documented fail CRN standards. If you'd bother studying these issues instead of mining for what you want to see, it may open your eyes. |
|
|
|
Post by poitsplace on Feb 13, 2009 6:31:09 GMT
Lets go back to the top of this thread where it was said: "Ever notice warmers claim UHI is of no consequence but they never provide empirical evidence?" At least now I have shown this is wrong. "Warmers" have regularly pointed out why we find UHI of no consequence. it's an entirely empirical argument - the empirical data (satellite, ocean and surface temperature data). Believing there is a significant UHI bias in HadCrut and GISTEMP actually provides more conflicts with the empirical data. I really think many on both sides are looking at this the wrong way. Let's look at what this data seems to suggest. Ocean warming (and the arctic which rests on it) are likely the result of a well documented, cyclic changes in circulation (like the PDO) Land warming only seems to have occurred in urbanized areas. The antarctic has been cooling for this "warming period" (note, it's NOT resting on an ocean). Places with no urbanization are cooling slightly, have no change or are at most warming very little. Urbanized areas are warming up an incredible amount. The land temperatures suggests CO2 plays little to no role in global warming. If the problem is urbanization though, that means the HUGE alternative energy sites we'd need to stop burning carbon, would increase urbanization and would therefore make things worse. |
|


