|
|
Post by glc on Feb 13, 2009 9:55:08 GMT
Land warming only seems to have occurred in urbanized areas. The antarctic has been cooling for this "warming period" (note, it's NOT resting on an ocean). Places with no urbanization are cooling slightly, have no change or are at most warming very little Urbanized areas are warming up an incredible amount
What data have you to support these statments? Leave aside the Antarctic stuff.
|
|
|
|
Post by nautonnier on Feb 13, 2009 10:37:06 GMT
The paper I cited analyzed the empirical data (surface temperature data compiled into records) and where urban areas are determined by light again from empirical data. An analysis which fits: "a. Relying on or derived from observation or experiment: empirical results that supported the hypothesis." In addition the paper you cite is no more empirical. And are further based on the assumption that "the spatial pattern of temperature trends in a widely used gridded climate data set is independent of socioeconomic determinants of surface processes and data inhomogeneities" which is obviously not true. More warming is expected over land than ocean, which means more warming in the northern hemisphere, which just happens to be where socioeconomic indicators are higher. In addition: "Using the regression model to filter the extraneous, nonclimatic effects reduces the estimated 1980–2002 global average temperature trend over land by about half." If this were true the UAH record would show more warming than the surface and the oceans would show more warming than the land. No my contention is that overall such UHI is corrected for sufficiently in the records. Again look at that small space between the UHI record and the GISTEMP record. There's not enough there to argue over is there? Determination of urban areas by looking for lights is a very 'American' assumption. In the U.S.A. all towns are lit by more lights than a European would expect, yet mist major roads in rural areas are not. In some countries all major roads are lit even in rural areas - Belgium keeps its autoroute lights on all night and all intersections and major roads etc as it needs to keep load on its nuclear power plants. In other areas lights actually go off late at night to save energy this is actually being enforced in some countries and in others purely to save money. So the assumption "lights = Urban" while not totally false especially in the U.S.A. is flawed. Taking a lighted area and comparing it to an unlit area might show UHI in some areas but not in others leading to an apparent low or non-existent UHI effect. |
|
|
|
Post by poitsplace on Feb 13, 2009 11:23:33 GMT
Land warming only seems to have occurred in urbanized areas. The antarctic has been cooling for this "warming period" (note, it's NOT resting on an ocean). Places with no urbanization are cooling slightly, have no change or are at most warming very little Urbanized areas are warming up an incredible amountWhat data have you to support these statments? Leave aside the Antarctic stuff. Sorry about that, I noticed my "IF" statement got lost in the edits. I was referring to the study in florida and was trying to say that IF it's similar elsewhere most AGW proponents are right about it warming but wrong about the cause while most skeptics would be right about it not warming (after adjusting for UHI) but wrong about man's contribution to any sort of warming at all. But as always, the science is most certainly not "settled" (at least it's certainly not settled on CO2) |
|
|
|
Post by steve on Feb 13, 2009 12:26:01 GMT
What a great article!
You know there's going to be a but don't you. Here it comes...
So if the temperature data collected and analysed by NASA and NOAA shows significant summer warming in Florida, then obviously they've failed to fully take account of UHI effects. Right?
If you go to this site and plot June-August data for, say, 2002-2007, you'll find that there isn't much summer warming in Florida.
Which suggests that the corrections for UHI may be in line with the expectations of the guy in the article.
|
|
|
|
Post by socold on Feb 14, 2009 17:47:34 GMT
I re-emphasise my point, which is that there simply isn't enough difference between UAH and GISTEMP to squeeze much UHI warming out of: 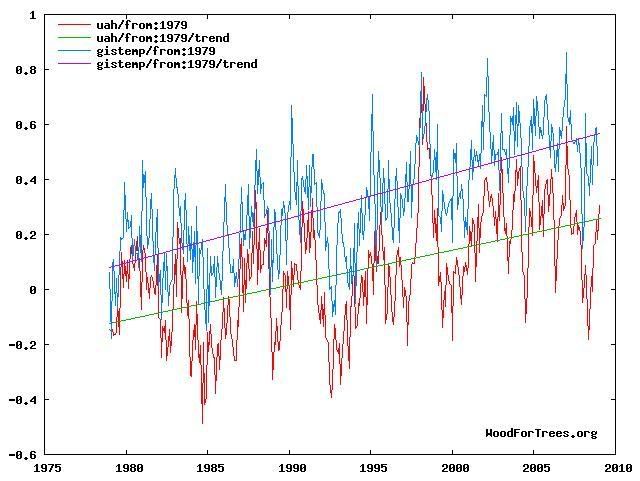 Take the difference between the slopes of both lines and deduct microsite biases and Hansen Fiddling. There's simply not a lot left for UHI. And interestingly when that John V fellow took the surfacestation.org findings and graphed the CRN 1+2 stations (the best ones), graphed the CRN 5 stations (the worst ones) and compared them to GISTEMP he found GISTEMP followed the best stations and the worst ones went their seperate way:  This suggests that GISTEMP is adjusting correctly for microsite issues. |
|
|
|
Post by magellan on Feb 14, 2009 20:41:04 GMT
I re-emphasise my point, which is that there simply isn't enough difference between UAH and GISTEMP to squeeze much UHI warming out of: Take the difference between the slopes of both lines and deduct microsite biases and Hansen Fiddling. There's simply not a lot left for UHI. And interestingly when that John V fellow took the surfacestation.org findings and graphed the CRN 1+2 stations (the best ones), graphed the CRN 5 stations (the worst ones) and compared them to GISTEMP he found GISTEMP followed the best stations and the worst ones went their seperate way: This suggests that GISTEMP is adjusting correctly for microsite issues. I was too harsh on John V, so reworded it. John V was confident his analysis was correct, but it was erroneous. Read through the CA archives and you'll see why. Regardless, there is something called "divergence". UHI adjustments are subjective, not scientific.  A recent discussion at UHI www.climateaudit.org/?p=4852and www.climateaudit.org/?p=4901Where is the source you got the information on John V? Please don't say you searched through Watts blog  |
|
|
|
Post by tilmari on Feb 14, 2009 23:02:01 GMT
What explanations other than UHI are for the difference between Hadcrut and UAH growing? I don't claim anything, I just ask what do you think, is it mainly UHI or mainly something else?
years UAH Hadcrut3 difference
1979-1988 -0.04 0.07 0.11
1989-1998 0.04 0.22 0.18
1999-2008 0.20 0.40 0.20
|
|
|
|
Post by magellan on Feb 15, 2009 3:44:13 GMT
What explanations other than UHI are for the difference between Hadcrut and UAH growing? I don't claim anything, I just ask what do you think, is it mainly UHI or mainly something else? years UAH Hadcrut3 difference 1979-1988 -0.04 0.07 0.11 1989-1998 0.04 0.22 0.18 1999-2008 0.20 0.40 0.20 1) change in measuring equipment; stevenson screen to MMTS with short cables forcing location close to buildings etc. 2) huge drop in number of stations in 1990's leaving mostly urban. 3) errors in HO-83 thermometers documented 4) no Quality Control performed ever (calibration etc.) 5) growing population, waste heat, increase in urban sprawl 6) land use change 7) inability to properly account for above uncertainties despite claims it's "good enough". I've never been one much for modeling approximations derived from incomplete data or when uncertainties cannot be properly assessed. Climate controlled labs don't claim the accuracy of these surface station networks. No climate scientist here, but measurement systems have been my bread and butter for 25 years. |
|
|
|
Post by socold on Feb 15, 2009 4:28:37 GMT
Below is a graph of difference between UAH and other records over time. The UAH-HadCrut difference is the blue line: 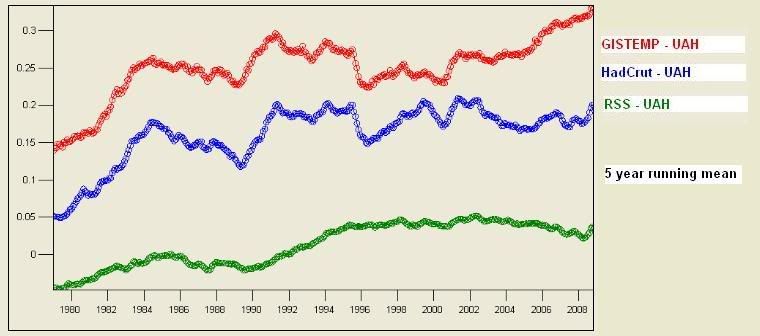 Most of the divergance occurs in the first 1979-1988 decade as your figures indicate. This early part of the record is also where the UAH-RSS divergance is, which suggests the diverger is in part UAH. Since the mid 1990s everything tracks fairly nicely until the recent GISTEMP divergance. The GISTEMP site has a document showing the effect of removing the arctic latitutes on the record and the effect primarly makes recent years cooler: data.giss.nasa.gov/gistemp/graphs/ArcticEffect.pdfI don't know for sure but this suggest the "GISTEMP-everyone else" divergance is, at least in part, rooted in the arctic, which implies a non-UHI cause. Either it's an error or the arctic really has warmed in the last few years. Below is the difference between the surface records (GISTEMP and HadCrut - grey line) and the satellite records (RSS and UAH - green line), each as 5 year running means of the difference. 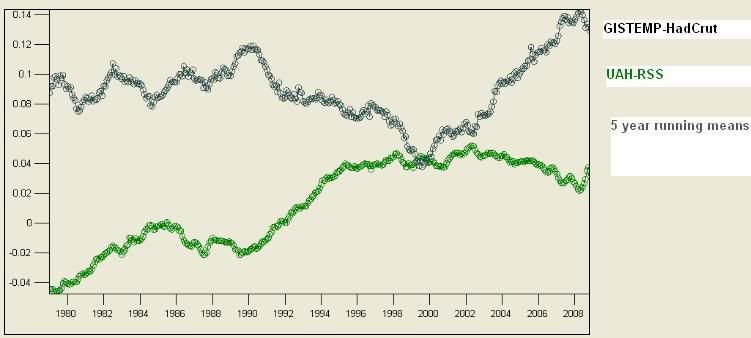 |
|
|
|
Post by magellan on Mar 18, 2009 16:39:36 GMT
Sorry to break the news, now even Phil Jones, AGW alarmist extraordinaire, keeper/protector of surface station data at Hadley, and who has refused to reveal his tax payer funded methods, has now conceded UHI is an issue. This may be related to Doug Keenan's formal accusation of fraud and Jones is looking for a way out without incriminating himself, who knows. wattsupwiththat.com/2009/03/18/finally-an-honest-quantification-of-urban-warming-by-a-major-climate-scientist/Baby steps, but as time moves on, there will be more capitulation by these warmologists as it will be self-evident. Of course human nature doesn't like to be proved wrong, and since Jones et al have boxed themselves in a corner, the process will be slow. So warmers, UHI has been well accounted for eh? ;D |
|
|
|
Post by steve on Mar 18, 2009 18:31:45 GMT
Magellan,
What exactly has been conceded in this paper? It's only sceptics that think that climate scientists do not believe UHI is worth investigating - they've been doing it for decades. And as far as I can see, this paper doesn't change things much:
For the record, Jones works at Climatic Research Unit, University of East Anglia, he's not the Director of the Hadley Centre as Watts seems to think.
|
|
|
|
Post by socold on Mar 18, 2009 23:51:38 GMT
Watt's spins and conflates two seperate phenomena
1) UHI existing
2) UHI increasing significantly over time
1 does not imply 2.
When researchers claim #2 - UHI doesn't increase significantly over time at a particular location, Watt's spins/strawmans it into #1 and claims the researchers are denying UHI exists. Then he brings out his graphs showing UHI exists as if that's counter evidence or suprises anyone.
For example his Nevada airport graph only demonstrates that if you move a station you need to adjust for the new placement location having a different UHI than the old one. Ie UHI exists (#1)
It doesn't mean temperature is rising over time due to UHI in the previous location (#2)
The UHI in both areas could have been constant for decades.
Obvious stuff. But easy to misrepresent...
The first comment on that blog entry is a beaut
|
|
|
|
Post by magellan on Mar 19, 2009 3:48:40 GMT
|
|
|
|
Post by kiwistonewall on Mar 19, 2009 4:01:16 GMT
UHI effect is always problematical. It is climate related, or, I should say, weather related. I can conceive of conditions where the UHI would be negative as well as positive.
Buildings, concrete and asphalt have two effects:
1. They are closer to a ideal black body than natural surfaces. This means increased absorption of heat AND more efficient emission of heat.
2. Disturbance of natural air flow. This will effectively make the urban area a greenhouse (in the way real greenhouses work) by holding volumes of air in place.
The problem is that the UHI effect will not be a constant, and cannot be used to reliably adjust AVERAGE temperatures. I have some sympathy for the practice of using the UHI to increase error uncertainties.
The truth is that there can be several degrees of additional heat at particular times (2C in Urban Melbourne) solely due to the UHI effect. At other times, zero, or even stronger overnight cooling.
It would be possible to perform a daily estimation and adjustment based on weather conditions to produce a daily adjusted temperature. Many days would have no adjustment, others a high adjustment.
This has not been done in the past, so such adjustments would have no historical meaning.
As long as we have the "Global Warming" fetish, backwards comparable data will be used. My preference would be entirely new measures going forward into the future. That is unlikely to happen, given the conservative approach of most organisations.
|
|
|
|
Post by magellan on Apr 11, 2009 4:03:58 GMT
The evidence just keeps coming..... There are many more current, but this is the latest based on Africa; another poster child for warmology. Add to that the recent acknowledgment (forced by accusations of fraud) by the AGW prognosticator Phil Jones at Hadley that China has strong UHI. See a pattern forming? ams.allenpress.com/perlserv/?request=get-pdf&doi=10.1175%2F2008JCLI2726.1and Translation: surface station data is crap and does not support CO2 as the cause of land warming. |
|


