|
|
Post by steve on Apr 10, 2009 11:55:37 GMT
Kiwistonewall has dug out this paper that I think is a good illustration of the greenhouse effect (that keeps the earth warm), and of the potential for the enhanced greenhouse effect (ie. AGW - the additional warming due to CO2 emissions). *big ol' snip* Does that sound so unrealistic? It doesn't sound unrealistic...except you missed the point about. The analogy is that currently the bands CO2 deals with are so saturated that almost all the energy is ALREADY being forced out the other frequencies. When you look at the spectrum of the observed output of the earth, it's already skewed to have more radiation in other bands than it would. A good example of this would be...many parallel resistors. For most of the spectrum the energy has almost no resistance. Then we've got CO2 which already has a substantial amount of resistance. Adding more CO2 so it resists more has almost no affect on the overall resistance because there's very little energy going out there anyway. No I didn't miss the point. That is exactly the point I am tackling. The spectrum you see - kindly linked in by numas - shows that there is at least 20 Watts per metre squared of radiation in the key band for CO2 just waiting to be mopped up if an extra chunk of CO2 is added to the mid-troposphere. |
|
|
|
Post by gettingchilly on Apr 10, 2009 21:05:12 GMT
Logarithms are such difficult things for kids to understand nowadays but my 8 year old is getting there. In a couple of years I'll get him to explain it ,especially to the AGW posters who obviously missed that lesson.
Come on, You just need to let go now. As much as you want CO2 back, she is dead.
You are just at stage 1. Denial. Only 4 to go.
|
|
|
|
Post by trbixler on Apr 11, 2009 2:13:35 GMT
Steve
I don't see the hat. Maybe your box on your table has one. But in the real world there is no hat. CO2 has been increasing the temperatures have been decreasing. The sea ice is above the satellite era mean. A static model has no chance of simulating the climate or weather. Entropy is always increasing and Newtonian physics applies for much of the atmosphere. The sun is at a minimum and that increases the GCRs that impinge upon the earth's atmosphere and the earth itself. You have not even scratched the surface with a box on your desk and static curves of adsorption. It is no wonder that Kiwi has not replied.
|
|
|
|
Post by magellan on Apr 11, 2009 3:21:41 GMT
Would someone be kind enough to point out the CO2 AGW signature in the Mid-Tropospheric data? Global. Nope, it's not there.  Tropics, where it supposed be accumulating heat   Waiting for the obfuscation...... Or how about on land in this example? Steve says the heat may be blown away into the countryside ;D    There really is no need to argue untested hypotheses and models; just present the evidence to support the argument. It's no more complicated than that. This is why warmers get their clocks cleaned in debates; they don't have evidence to support the CO2 AGW fairytale. |
|
|
|
Post by magellan on Apr 11, 2009 4:16:01 GMT
I reproduce Fig 4 here: Note: The peak of the Earth radiation curve is at the OZONE absorption. This is going to be far more critical than any CO2 absorption outside the main radiation passing out from Earth. The other two big "bites" are water (5-9 microns) and Ozone again at 15 Microns - while CO2 also absorbs at 15 Microns, it is likely to be mainly Ozone, given the massive 9.5 Micron Bite. I don't see much room for CO2 to have any measurable effect at all. "In fact, pound for pound, ozone is about 3000 times stronger as a greenhouse gas than CO2." Welcome numas! The greenhouse effect is caused by water vapour, CO2, methane, ozone and other gases. It keeps earth approximately 30C warmer than it would be if the atmosphere were pure O2, N2 or argon. The *enhanced* greenhouse effect is the effect caused by *increasing* one or other of the greenhouse gases. The main concerns are the tropospheric *increase* in CO2, methane, N20, halocarbons *and* ozone. Normally debates get stuck on CO2 because the CO2 increase currently is having the biggest effect. Ozone is a stronger greenhouse effect, and it is increasing. But the the increase is less than for CO2 such that the effect is thought to be no more than 1/6 to 1/3 of the total enhanced greenhouse effect. This is the current IPCC assessment: 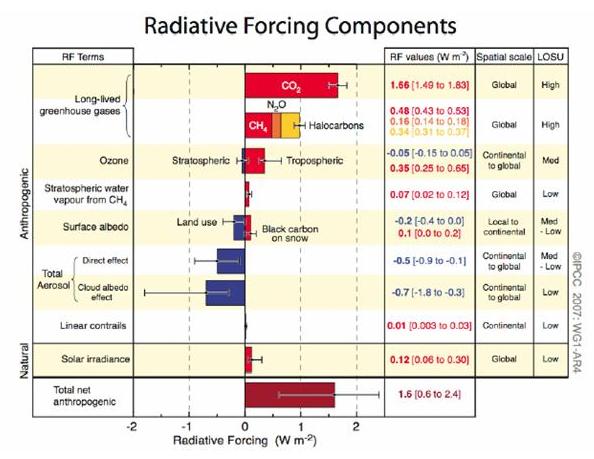 LOL, did you look over to the right column under "LOSU"? That is 'Level of Scientific Understanding'. Of course the resulting overall anthropogenic figures are based on climate model outputs- GIGO. According to Hansen, IPCC pulled aerosol figures out of a hat (or somewhere else). You've yet to address that. Any reason why? You do realize even small changes in cloud cover, if they could be quantified could easily change the amount of solar radiation reaching the surface, which in turn . Mysteriously, this is ignored by IPCC and Reinvented Climate. |
|
|
|
Post by poitsplace on Apr 11, 2009 4:58:44 GMT
LOL, did you look over to the right column under "LOSU"? That is 'Level of Scientific Understanding'. Of course the resulting overall anthropogenic figures are based on climate model outputs- GIGO. According to Hansen, IPCC pulled aerosol figures out of a hat (or somewhere else). You've yet to address that. Any reason why? You do realize even small changes in cloud cover, if they could be quantified could easily change the amount of solar radiation reaching the surface, which in turn . Mysteriously, this is ignored by IPCC and Reinvented Climate. WOW, I had completely missed that. Models use feedbacks for MOST WARMING...yet we have little knowledge of the feedbacks. |
|
|
|
Post by steve on Apr 11, 2009 13:06:03 GMT
Magellan, Your first point is off-topic. I suspect you are looking at the contaminated T2 dataset rather than T2LT which shows the warming trend that is within model expectations, but since you don't reference your data (I'll set Steve McIntyre onto you for that error) I can't comment. Here's T2LT: www.junkscience.com/MSU_Temps/UAHMSUglobe.html Obviously, for your second point, you tried to set me a trap and I didn't fall into it. I said that increased near surface CO2 would not be detectable in the temperature record, and your data agrees with me. So I don't know what you are getting excited about. Even these sceptics agree with me: www.agu.org/pubs/crossref/2001/2000GL012632.shtmlIn your next post, the reason that TSI has a "low level" of understanding is because the net change is compared with 1750. We don't have good knowledge of TSI in 1750! We do however have good knowledge of TSI and other solar impacts since 1950 or so, and the evidence that any of the changes since 1950 or so could have caused warming is minimal. Anyway, this thread was addressed really at the people who believe that CO2 cannot have an impact, not at the people who believe other things can have a bigger impact, so I'd appreciate if you could stick to the topic. |
|
|
|
Post by icefisher on Apr 11, 2009 13:16:02 GMT
Magellan, Your first point is off-topic. I suspect you are looking at the contaminated T2 dataset rather than T2LT which shows the warming trend that is within model expectations, but since you don't reference your data (I'll set Steve McIntyre onto you for that error) I can't comment. Here's T2LT: www.junkscience.com/MSU_Temps/UAHMSUglobe.htmlYou swapped out lower troposphere for mid troposhere. . . .try to stay on topic! |
|
|
|
Post by steve on Apr 11, 2009 13:37:14 GMT
Magellan, Your first point is off-topic. I suspect you are looking at the contaminated T2 dataset rather than T2LT which shows the warming trend that is within model expectations, but since you don't reference your data (I'll set Steve McIntyre onto you for that error) I can't comment. Here's T2LT: www.junkscience.com/MSU_Temps/UAHMSUglobe.htmlYou swapped out lower troposphere for mid troposhere. . . .try to stay on topic! The mid-troposphere data is contaminated by stratospheric cooling, so it doesn't tell you anything. Roy Spencer reanalysed the data by looking at cross-sections of the atmosphere at different angles and came up with the T2LT dataset which tries to cancel out the contribution of the cooling stratosphere (something that is also partly caused by increased greenhouse gases). See this quote from quite an old UAH newsletter: www.uah.edu/news/newsread.php?newsID=153 |
|
|
|
Post by icefisher on Apr 11, 2009 15:52:13 GMT
You swapped out lower troposphere for mid troposhere. . . .try to stay on topic! The mid-troposphere data is contaminated by stratospheric cooling, so it doesn't tell you anything. Roy Spencer reanalysed the data by looking at cross-sections of the atmosphere at different angles and came up with the T2LT dataset which tries to cancel out the contribution of the cooling stratosphere (something that is also partly caused by increased greenhouse gases). See this quote from quite an old UAH newsletter: www.uah.edu/news/newsread.php?newsID=153LOL! so all you are doing is obfusicating the basic truth that the models have been shown to be falsified. . . .or at least thats the obviously conclusion being drawn in your references. Additionally, I have to take the reference to carbon dioxide increases as a reason for stratopheric cooling with a grain of salt. There seems to be a pedantic tendency in the science community these days, even the good guys, to just repeat stuff they read somewhere else. That problem stems from funders looking for offhanded comments in science papers blaming CO2 for everything including your morning burnt toast. I have seen that first hand as it extends well beyond climate science. Ultimately that sort of mind pollution affects us all. But its hardly relevant to this discussion because when you actually bother to read your references you will find it actually supports the argument Magellan is making and bellylaughs at yours. |
|
|
|
Post by magellan on Apr 12, 2009 4:16:00 GMT
Magellan, Your first point is off-topic. I suspect you are looking at the contaminated T2 dataset rather than T2LT which shows the warming trend that is within model expectations, but since you don't reference your data (I'll set Steve McIntyre onto you for that error) I can't comment. Here's T2LT: www.junkscience.com/MSU_Temps/UAHMSUglobe.htmlObviously, for your second point, you tried to set me a trap and I didn't fall into it. I said that increased near surface CO2 would not be detectable in the temperature record, and your data agrees with me. So I don't know what you are getting excited about. Even these sceptics agree with me: www.agu.org/pubs/crossref/2001/2000GL012632.shtmlIn your next post, the reason that TSI has a "low level" of understanding is because the net change is compared with 1750. We don't have good knowledge of TSI in 1750! We do however have good knowledge of TSI and other solar impacts since 1950 or so, and the evidence that any of the changes since 1950 or so could have caused warming is minimal. Anyway, this thread was addressed really at the people who believe that CO2 cannot have an impact, not at the people who believe other things can have a bigger impact, so I'd appreciate if you could stick to the topic. I'd think anyone even remotely familiar with weather/climate data would know what UAH Mid Troposphere data is. You are claiming CO2 has a large impact on climate (and hence weather as well), therefore I am countering that with saying it has not even a measurable impact. You just stepped into a pile of poo. First and foremost, there is no need to contact Steve McIntyre as I already did which led to the 'Gavin and the Big Red Dog' post. Oh yes, this is one of my pet projects. www.climateaudit.org/?p=4731In it you will find, despite all the recent backpedaling by the fraudsters at RC, a distinct reference to mid-tropospheric warming as a "fingerprint" (the ubiquitous hotspot) of anthropogenic warming caused by rising GHG levels, namely CO2, is in the literature and IPCC AR4. Sorry, its written in stone: www.osti.gov/energycitations/servlets/purl/881407-xk2Sdg/881407.pdfThat would be T2, but even if it is measuring part of the stratosphere, temperatures should be trending upward and they are not. Provide evidence the atmosphere is warming in agreement with climate models in the 'middle and upper' tropical troposphere. You also stated, without citation, that models are in agreement with satellite data. So again I ask for the supporting reference. Oh please say it is Santer et al 2008 ;D Now for your assumption that "skeptics" agree with you, it would have wise to do a bit more research and see what one of the authors actually states. www.co2science.org/subject/u/summaries/phxurbanco2dome.phpThe only way for the CO2 AGW fraud to be validated is for a strong net positive feedback from water vapor. Dessler et al 2008, another polished turd similar to Santer's statistical trickery, attempted to produce agreeable results via water vapor data, but made no mention of cloud dynamics anywhere in the paper. They also failed to apply the very basic statistical tools any science paper should include to test their hypothesis. But this is how AGW augurs have promoted their junk science, much through torturing statistics. First warmers say UHI is negligible, now you say CO2 is. Interesting. Odd, you accused me of wondering off topic, then you go off on a misguided tangent about TSI. |
|
|
|
Post by jimg on Apr 12, 2009 17:10:26 GMT
|
|
|
|
Post by trbixler on Apr 12, 2009 22:29:04 GMT
|
|
wylie
Level 3 Rank

Posts: 129
|
Post by wylie on Apr 12, 2009 23:45:56 GMT
I reproduce Fig 4 here: Note: The peak of the Earth radiation curve is at the OZONE absorption. This is going to be far more critical than any CO2 absorption outside the main radiation passing out from Earth. The other two big "bites" are water (5-9 microns) and Ozone again at 15 Microns - while CO2 also absorbs at 15 Microns, it is likely to be mainly Ozone, given the massive 9.5 Micron Bite. I don't see much room for CO2 to have any measurable effect at all.  "In fact, pound for pound, ozone is about 3000 times stronger as a greenhouse gas than CO2." EFFECT OF OZONE ON Global TEMPERATURES: I find the possibility that ozone (and oxygen) may be more important for global temperatures than CO2 fascinating. The recent announcement by NASA said that UV output by the sun was lower by 6% while TSI was down by only 0.1%. Since UV affects the concentration of (and absorption by) ozone, this could be a huge impact. The greenhouse gases imply an effect on the outgoing long wave radiation, but DIRECT absorption by ozone (and oxygen below 180nm) would heat up the atmosphere by the incoming SHORT wavelength solar radiation. 6% is a HUGE number. I would be very interested in hearing whether or not anyone else believes that Ozone (and oxygen) could be more responsible for "global warming" (directly from the Sun) than CO2. WHat do you think? Ian |
|
|
|
Post by trbixler on Apr 13, 2009 3:44:05 GMT
Looking at the chart and then think Svensmark. Notice the clear and cloud adsorption. Something about 36 and counting that is related.
|
|


