

Post by Ratty on Feb 8, 2019 6:00:12 GMT
From another thread .....

 You're welcome. As for how cold it will get, from my calculations, it looks like we have a 2.8 degree Celsius decline by the year by 2029-2030. It is going to get colder and colder during the 2020s and by the mid-2030s, we will already be within the mini-ice age.
As global cooling begins in December 2017, we will have, according to my climate forecast, the next ENSO between 2019-2022, a moderate El Nino followed by a strong La Nina - the first in modern times under the new climate regime of global cooling.
TRACKING THE FORECASTS - HOUSEKEEPING
I lose track so I'm stacking some of Astro's forecasts here as I review this thread. Some place I can go back to when I have a brain "burp".
Next ENSO Event - 2019-2022
Forecast Moderate El Nino - mid 2019 into 2020
Forecast Strong La Nina - 2021 - 2022
Temperature decline (global I assume) of 2.8 C - 2016 to 2029-30 (essentially the next solar cycle - SC25).
If I missed anything there Astro, please correct me.
Well, I went in and grabbed a few past graphs to try and evaluate what a 2.8 C temperature shift could look like AND how fast such events might happen given past data, IF we even have a comparable.
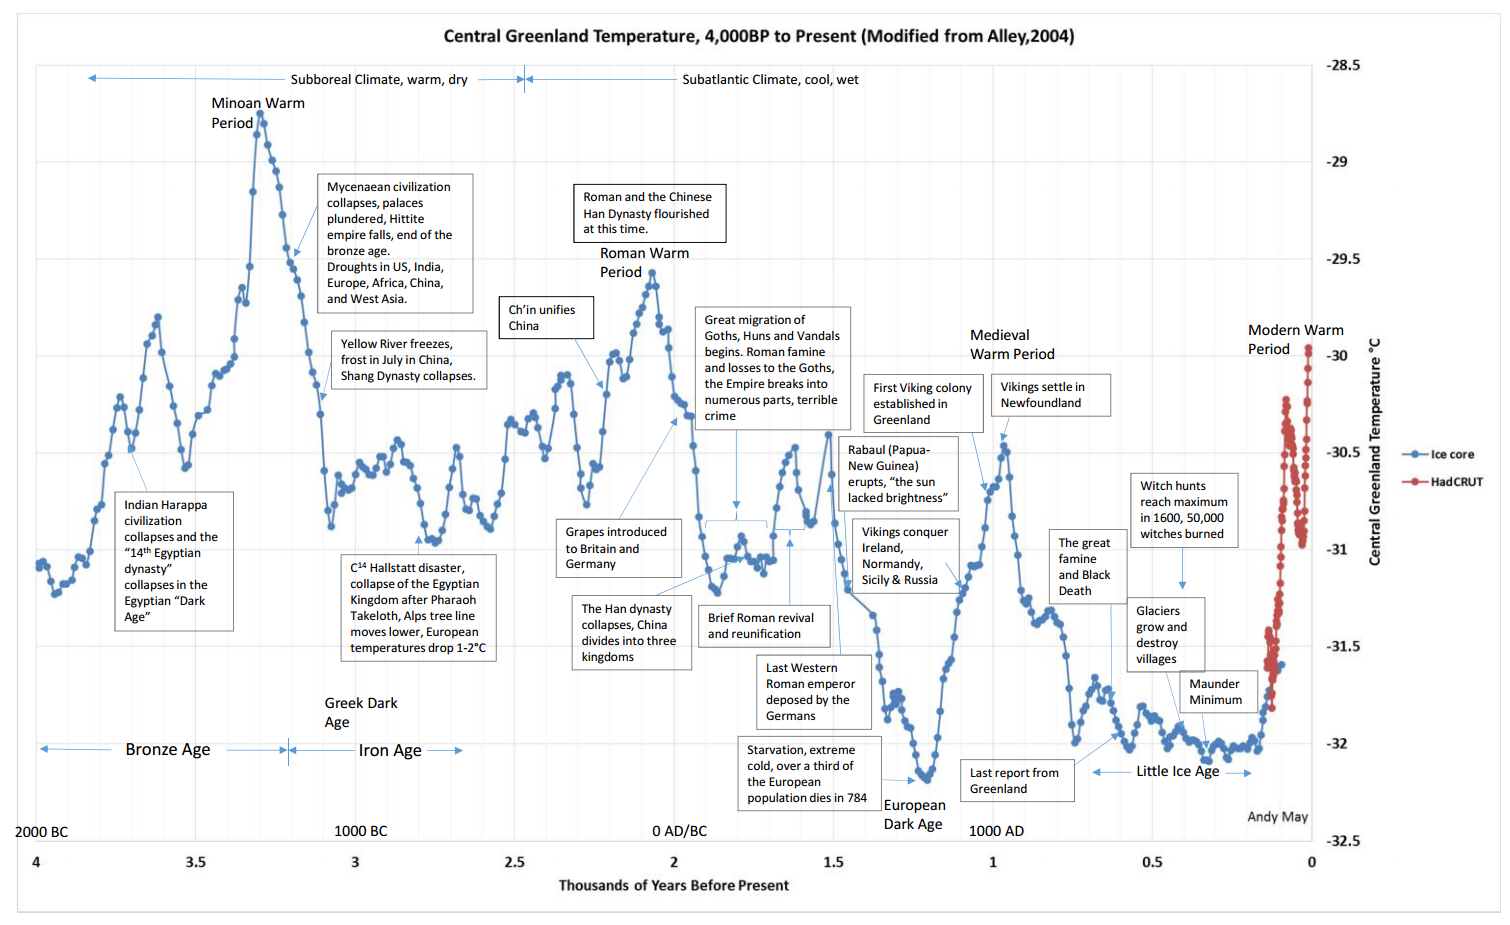
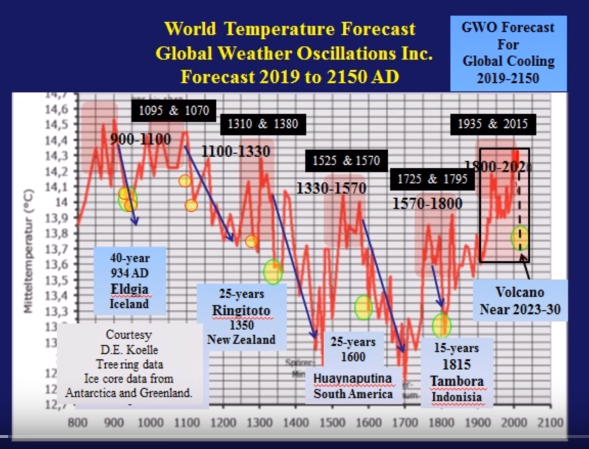
World Long Historical
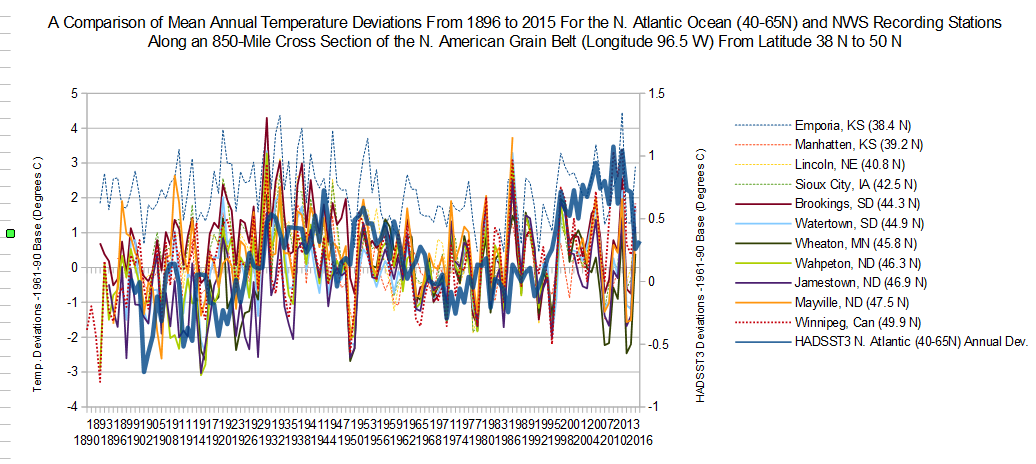
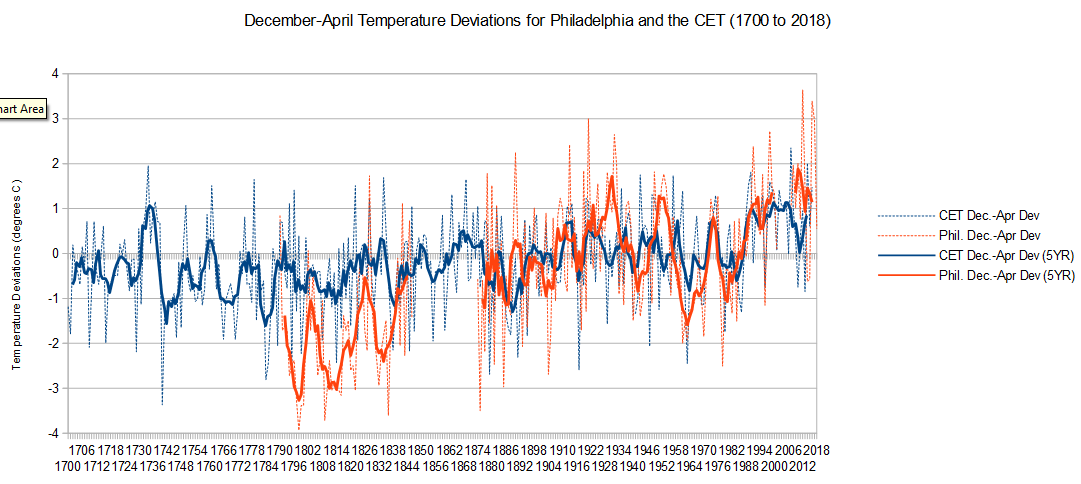
First, I have no global temperature time series to compare. Most seem to be based on Ice core and tree ring analysis, and the range from top to bottom is nowhere near 2.8 C. Graph 5 for the American Grain Belt cross section shows a range of about 6 C, but that is regional, not global. Graph 6 compares the long winter records for Philadelphia to the CET and Philly has a max range of about 5 C. Again local/regional, not global. A drop of 2.8 C for graph 5 would bring temps back to the late 1800s. The same for graph 6 would return temps to Dalton Minimum winter levels.
Base Temperature Transition Time
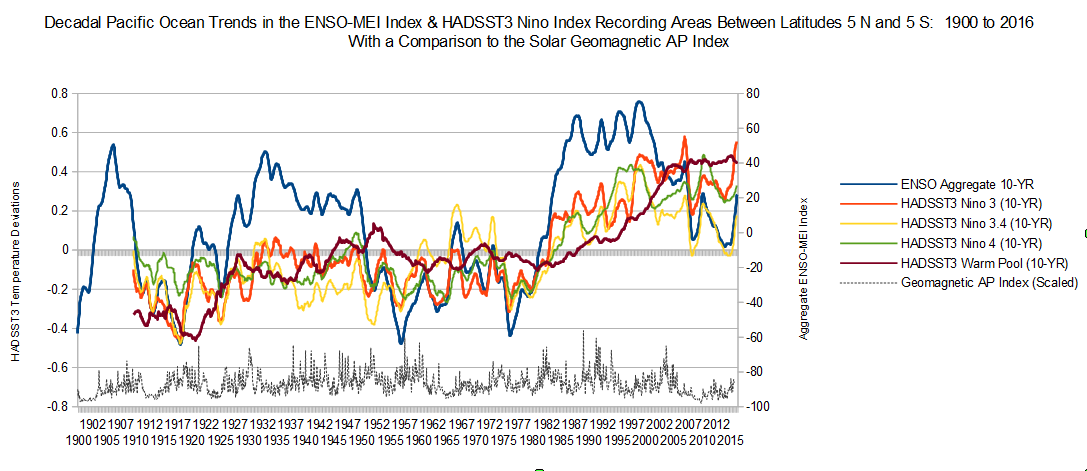
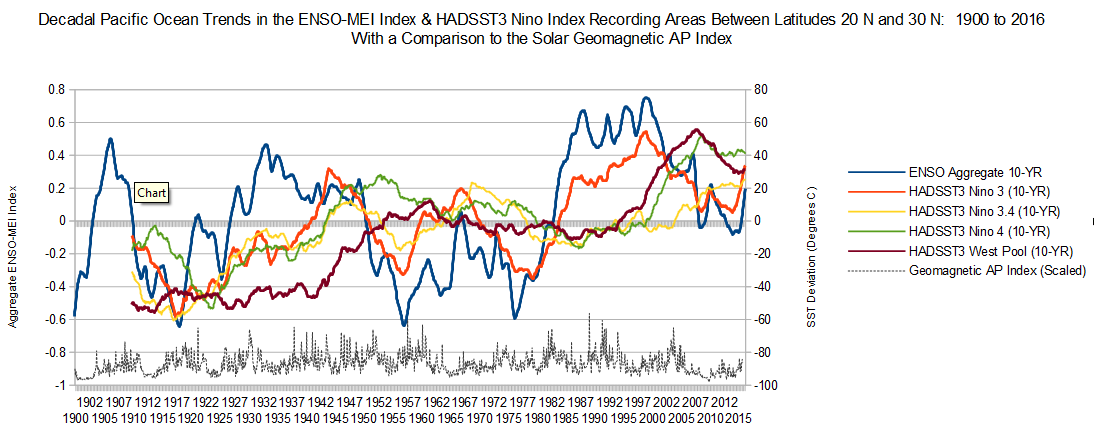
Many historical graphs show that temperatures and indexes can change dramatically within a decade or so. ENSO aggregate values in graphs 3 & 4 show a sharp drop from 1947-57 and an even sharper rise (the Great Climate Shift) from 1976 to 1986. The Philadelphia winter times series also shows these same shifts of about 2 to 2.5 C. The American Grain Belt series show that annual temperature variance has increased dramatically since about 2005, with year to year swings in temperature spanning 4 C. I know that Joe believes that ocean heat may take a long time to "bleed off", but maybe they said the same thing back in the late 1940s. I'm not sure we really have a bankable clue as to how fast the ocean is transferring heat to the atmosphere (And it's still a travesty Kevin!). One decade from 2015 (which was when this forecast was made) brings us to 2025, 3 years after the strong forecasted La Nina, and deep into the heart of SC25. If, by then, we are still asking each other if it's over, then .... Best bet may still be to keep your coats ... and buy quantities of good quality thermal undies. Sig. Can we start a good quality wool exchange?

As global cooling begins in December 2017, we will have, according to my climate forecast, the next ENSO between 2019-2022, a moderate El Nino followed by a strong La Nina - the first in modern times under the new climate regime of global cooling.
TRACKING THE FORECASTS - HOUSEKEEPING
I lose track so I'm stacking some of Astro's forecasts here as I review this thread. Some place I can go back to when I have a brain "burp".
Next ENSO Event - 2019-2022
Forecast Moderate El Nino - mid 2019 into 2020
Forecast Strong La Nina - 2021 - 2022
Temperature decline (global I assume) of 2.8 C - 2016 to 2029-30 (essentially the next solar cycle - SC25).
If I missed anything there Astro, please correct me.
Well, I went in and grabbed a few past graphs to try and evaluate what a 2.8 C temperature shift could look like AND how fast such events might happen given past data, IF we even have a comparable.
World Long Historical
First, I have no global temperature time series to compare. Most seem to be based on Ice core and tree ring analysis, and the range from top to bottom is nowhere near 2.8 C. Graph 5 for the American Grain Belt cross section shows a range of about 6 C, but that is regional, not global. Graph 6 compares the long winter records for Philadelphia to the CET and Philly has a max range of about 5 C. Again local/regional, not global. A drop of 2.8 C for graph 5 would bring temps back to the late 1800s. The same for graph 6 would return temps to Dalton Minimum winter levels.
Base Temperature Transition Time
Many historical graphs show that temperatures and indexes can change dramatically within a decade or so. ENSO aggregate values in graphs 3 & 4 show a sharp drop from 1947-57 and an even sharper rise (the Great Climate Shift) from 1976 to 1986. The Philadelphia winter times series also shows these same shifts of about 2 to 2.5 C. The American Grain Belt series show that annual temperature variance has increased dramatically since about 2005, with year to year swings in temperature spanning 4 C. I know that Joe believes that ocean heat may take a long time to "bleed off", but maybe they said the same thing back in the late 1940s. I'm not sure we really have a bankable clue as to how fast the ocean is transferring heat to the atmosphere (And it's still a travesty Kevin!). One decade from 2015 (which was when this forecast was made) brings us to 2025, 3 years after the strong forecasted La Nina, and deep into the heart of SC25. If, by then, we are still asking each other if it's over, then ....
 Best bet may still be to keep your coats ... and buy quantities of good quality thermal undies. Sig. Can we start a good quality wool exchange?


