|
|
Post by missouriboy on Apr 25, 2021 0:29:14 GMT
Been thinking about how you work out what the climate is doing at any particular moment and we look at the ENSO stuff and the SOI plus other signals and from there come up with ideas as to what will happen in the future, and to quote someone "predictions are tricky, especially about the future". or something. From the continuous flow of stuff on this site very especially MB and Naut it's clear to me that where the tropical convergent zone is and its consequent rain belt which is fueled by an airflow under the Hadley cell constrained by the divergent zone where dry air descends and moves both ways. The width of the Hadley cell in my view defines if the climate is in a warm or cold phase. Wide warm, narrow cold. It's the global airconditioning system and Willis E had a graphic on one of his papers (lost to me) that defined the net-zero inward/outward radiation line in the NH and SH unsurprisingly about where the divergent zones were. Is there any way to aggregate the latitudinal wind's direction and energy so as to track through time the area of the globe between the divergent zones? It may be an indicator of global warming and cooling. We know that the tropics are temperature stable largely through 20C climate fluctuations from ice ages to hot phases and under the Hadley cells plus a bit for seasonal flux live the happiest of folk on earth, is it getting bigger or smaller. Not sure if this is clear? If one had the data, one should be able to do that. BIG IF. Note the current Nullschool winds in the following. earth.nullschool.net/#current/ocean/surface/level/overlay=none/orthographic=-37.16,35.86,502 We are 1 month past the equinox thus sun's rays vertical at about 7 N latitude. You can see the West-Central Atlantic high pressure zone clearly. And on its eastern flank (right at the azores), you have a low pressure cell moving south. This is exactly what has been happening to cause the collapse of pressure in the azores as we move into summer over the past few years. Putting a kink in the lives of some of the happiest of folk on earth. Their flank has been breached and more of their weather is coming from the North. Even the islands further south are beginning to show summer pressure declines. Me thinks that net-zero inward / outward radiation line now has many bends in it ... some of which may be persistent. The Saharran peoples of past centuries may have been the benneficiaries of similar past shifts, which caused their locality to become wetter. Climate is only latitudinaly stationary in our imagination. Surface pressure maps averaged across weeks and months might give you the data to estimate that line. Gridded daily / weekly pressure maps could be aggregated over whatever timeframe and geographic area needed. With a long enough timeseries, I dare say that if the Hadley cells have been weakening over the last few years, it would stand out like a sore thumb. |
|
|
|
Post by nonentropic on Apr 25, 2021 1:18:34 GMT
Yes, you get the point totally. If you look at clouds and the way models don't include the biggest, alright 2nd biggest influence on temperature there is a problem.
The variables associated with cloud are as follows but not limited to the following. time of day, altitude, season, latitude proximity to land/water, wind flow from tropics to tropics, etc., etc. may be a further 20 drivers. Plus some operate to lift global and some reduce it.
So in my mind unresolvable with a strong risk that confirmational bias will allow a dialable outcome and we have seen a lot of that to date.
The metric needs to be unimpeachable and easily measured with satellites so spacially unconstrained. Not some low-density proxy begging for homogenization. Mannipulation.
|
|
|
|
Post by nonentropic on Apr 25, 2021 1:37:05 GMT
|
|
|
|
Post by missouriboy on Apr 25, 2021 3:52:15 GMT
|
|
|
|
Post by missouriboy on Apr 27, 2021 21:34:05 GMT
And as we follow the development of the current Nina, it might be useful to look how Ninas have progressed in other solar cycles. The following chart shows (left side) normalized Nino 3.4 (thus mid-Pacific) values for solar cycles 20 to 25. Chart right shows normalized sunspots for the same solar cycles. Each chart line begins in January of the year in which the pre-cycle Nina begins. This coincides nicely with the end of solar cycle minimums. The pre-cycle Nino is thus split at the highest point of the pre-cyle Nino, with its beginnings on the right, and its ending on the left. Observations follow ... 1. As the Easterlies die down together with whatever other forces are involved, warm western waters move eastward in Kelvin waves that surface over a 12 to 24 month time frame. As the new cycle begins to emerge, the easterlies pick up, together with whatever other forces may be operating, and warm waters are moved westward, being replaced by upwelling cold waters along the western S. American coast line. These also move westward into the Central Pacific. 2. It is noted that sunspots for solar cycles 24 and 25 are much lower than other cycles, including SC20, which was the low cycle separating the two halves of the hundred-year grand maximum. 3. All pre-cycle Ninas bottom in the early months of the first two years of the new solar cycle, and wane as the cycle progresses toward and through its maximum sunspot activity, which typically starts a sharp decline by about month 60. Internal Ninos occur in various strength as the solar cycle passes its peak and begins its sharp decline. I am assuming that this second Nino wave occurs when the easterlies die down in conjunction with falling solar activity, releasing western warm pool waters that have accumulated as eastern Pacific waters are warmed and pushed westward by the easterlies. This is likely too simplistic an explanation. I note that low solar cycle 20 is very different than the others, having major Ninas develop along its downward course. It was also a much longer cycle, equivalent to SC23. 4. The pre-cycle Nina associated with SC25 appears to be progressing along the low path. Reviews with suggestions and notations of my errors would be appreciated. 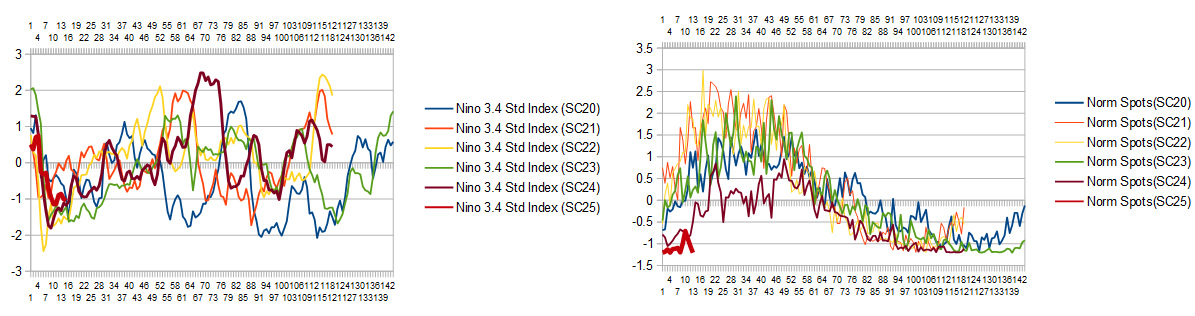 |
|
|
|
Post by nautonnier on Apr 30, 2021 14:06:29 GMT
And as we follow the development of the current Nina, it might be useful to look how Ninas have progressed in other solar cycles. The following chart shows (left side) normalized Nino 3.4 (thus mid-Pacific) values for solar cycles 20 to 25. Chart right shows normalized sunspots for the same solar cycles. Each chart line begins in January of the year in which the pre-cycle Nina begins. This coincides nicely with the end of solar cycle minimums. The pre-cycle Nino is thus split at the highest point of the pre-cyle Nino, with its beginnings on the right, and its ending on the left. Observations follow ... 1. As the Easterlies die down together with whatever other forces are involved, warm western waters move eastward in Kelvin waves that surface over a 12 to 24 month time frame. As the new cycle begins to emerge, the easterlies pick up, together with whatever other forces may be operating, and warm waters are moved westward, being replaced by upwelling cold waters along the western S. American coast line. These also move westward into the Central Pacific. 2. It is noted that sunspots for solar cycles 24 and 25 are much lower than other cycles, including SC20, which was the low cycle separating the two halves of the hundred-year grand maximum. 3. All pre-cycle Ninas bottom in the early months of the first two years of the new solar cycle, and wane as the cycle progresses toward and through its maximum sunspot activity, which typically starts a sharp decline by about month 60. Internal Ninos occur in various strength as the solar cycle passes its peak and begins its sharp decline. I am assuming that this second Nino wave occurs when the easterlies die down in conjunction with falling solar activity, releasing western warm pool waters that have accumulated as eastern Pacific waters are warmed and pushed westward by the easterlies. This is likely too simplistic an explanation. I note that low solar cycle 20 is very different than the others, having major Ninas develop along its downward course. It was also a much longer cycle, equivalent to SC23. 4. The pre-cycle Nina associated with SC25 appears to be progressing along the low path. Reviews with suggestions and notations of my errors would be appreciated. How much are the kelvin wave Ninas and Ninos affected by changes in LOD as would be expected with barycenter changes (sorry)  |
|
|
|
Post by missouriboy on Apr 30, 2021 15:30:42 GMT
|
|
|
|
Post by nautonnier on Apr 30, 2021 16:21:51 GMT
The problem with using simple training - now often called Artificial Intelligence Machine Learning, is that if some important factor does NOT happen in the training period, the Artificial Intelligence cannot learn from it (rather obviously). This means short or non-representative training periods can lead to completely nonsensical results so it is not a good idea to 'assume it will all work' and minimize the training of the AI system. My concern with the www.coolingnews.com/the-cause-of-enso idea is that the training, forecasting and testing periods seem to have been chosen mathematically rather than based on the actual varying ENSO states. This sets up the system to have insufficient learning to make correct forecasts. |
|
|
|
Post by missouriboy on May 6, 2021 0:36:48 GMT
April data are now in and ENSO Regions 3 and 1+2 continue to follow the low path. By August we should know. 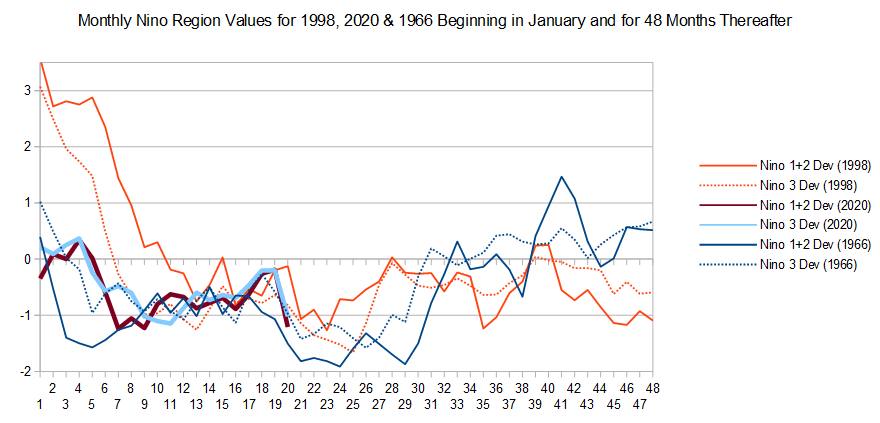 |
|
|
|
Post by missouriboy on May 10, 2021 19:44:18 GMT
UAH regional lower troposphere temperature anomalies for April are in. The decline has paused as ENSO anomalies rise in the usual spring break between the first and second halves of the current La Nina. If this Nina proceeds as per previous Ninas, the UAH anomaly decline should resume sometime in the summer timeframe. The anomaly for the Tropics is at the lowest point since 2012 (-0.28C). The Tropic anomaly has dropped 0.9C since early 2020. Another 0.5C to record territory. Warmests are on their knees ... a most unusual position.  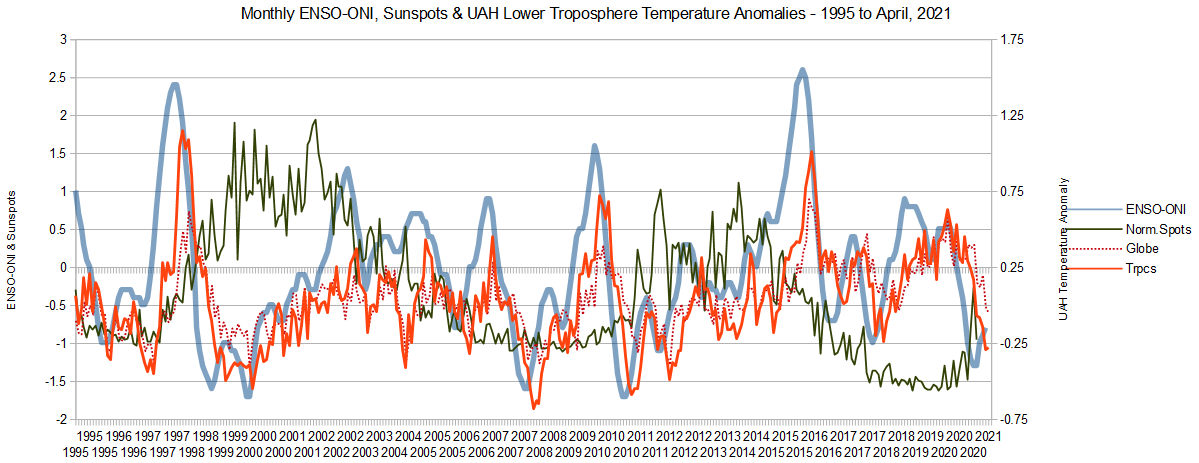 |
|
|
|
Post by acidohm on May 10, 2021 21:03:04 GMT
Warmests are on their knees ... a most unusual position. They're still gluing their hands to things in London.....I bet they wish it was warmer... |
|
|
|
Post by missouriboy on May 10, 2021 21:35:25 GMT
Warmests are on their knees ... a most unusual position. They're still gluing their hands to things in London.....I bet they wish it was warmer... Perhaps if they just left them glued there. They would get tired, cold and hungry after a while. Until then, they could be like self-imposed stocks. Sell tickets to the tourists and let them throw rubbish at them. I really should be ashamed of myself.  Perhaps you could entertain them by asking them for the physics of how CO2 could accomplish this. |
|
|
|
Post by nonentropic on May 10, 2021 21:42:06 GMT
I think the social welfare department should issue free glue and defund the ungluers. That is not a Chinese population.
|
|
|
|
Post by Ratty on May 11, 2021 0:29:52 GMT
I think the social welfare department should issue free glue and defund the ungluers. That is not a Chinese population. Would you impose a quota on the free glue? |
|
|
|
Post by nonentropic on May 11, 2021 1:58:39 GMT
Simply a show of hands and brush it on, big hands more, etc. The key is the key so clean pavement properly for excellent adhesion.
|
|


 Perhaps you could entertain them by asking them for the physics of how CO2 could accomplish this.