|
|
Post by missouriboy on Apr 29, 2020 4:17:08 GMT
Missouri not sure if this is possible on the global temperature data available now but Ill ask if this is possible to achieve. looking at the global temperature it seems that a warm or cold Antarctic/arctic has a much higher weighting than is due for each hemisphere. and the reverse for the tropics. The mid latitudes are a wash of warm cold warm cold etc as you go round the globe but the extreme moves of the the cold regions is really a symptom of a very dry atmosphere and pushes the world and hemisphere averages around without any real trend picture. Smoothing is weak often because it hides a current change by washing it in historical data. adjusting for the enthalpy in essence is different. not a clear question but expect you have had worse. I'm still thinking about this one. But while I was thinking I started charting N. Pole and S. Pole temp. data. Kind of interesting. The bottom chart below shows 5-mth running averages. Note the S, Pole is relatively flat from 1978 to 2020, but with big swings in the later half. The N. Pole goes down through 1991 and then rises dramatically. Now really interesting. I take the difference of the 2 poles (NoPol minus SoPol) and plot it against the 13-Mth untrended AMO. Amazing fit. The last 4 months has been dramatically down. Shift? 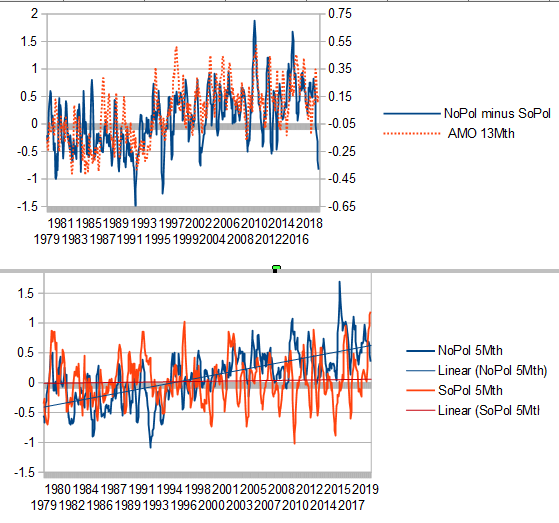 |
|
|
|
Post by duwayne on Apr 29, 2020 16:37:30 GMT
This animated chart is just beginning to show signs of a counterclockwise ocean rotation in the ENSO region which could lead to surface cooling and La Nina if it continues. What's needed, as most know, is an increase in east to west winds which would bring cool water to the surface in the east and blow the cool surface water across the ENSO region.  Link please? |
|
|
|
Post by sigurdur on Apr 30, 2020 0:53:33 GMT
Code. You will still be alive. Ski season is nearly over.
|
|
|
|
Post by missouriboy on May 3, 2020 16:50:44 GMT
Missouri not sure if this is possible on the global temperature data available now but Ill ask if this is possible to achieve. looking at the global temperature it seems that a warm or cold Antarctic/arctic has a much higher weighting than is due for each hemisphere. and the reverse for the tropics. The mid latitudes are a wash of warm cold warm cold etc as you go round the globe but the extreme moves of the the cold regions is really a symptom of a very dry atmosphere and pushes the world and hemisphere averages around without any real trend picture. Smoothing is weak often because it hides a current change by washing it in historical data. adjusting for the enthalpy in essence is different. not a clear question but expect you have had worse. I'm still thinking about this one. But while I was thinking I started charting N. Pole and S. Pole temp. data. Kind of interesting. The bottom chart below shows 5-mth running averages. Note the S, Pole is relatively flat from 1978 to 2020, but with big swings in the later half. The N. Pole goes down through 1991 and then rises dramatically. Now really interesting. I take the difference of the 2 poles (NoPol minus SoPol) and plot it against the 13-Mth untrended AMO. Amazing fit. The last 4 months has been dramatically down. Shift? Adding a clearer chart showing the relationship between the difference in UAH Lower Troposphere temperature anomalies between the poles (13-month average) and the untrended AMO (13 Month avg.). The North Pole has really been dropping over the last 5 months. Are shifting back to the pole-to-pole relationships associated with a negative AMO? Note that April NAO (Azores-Iceland) hit a negative monthly record in April. 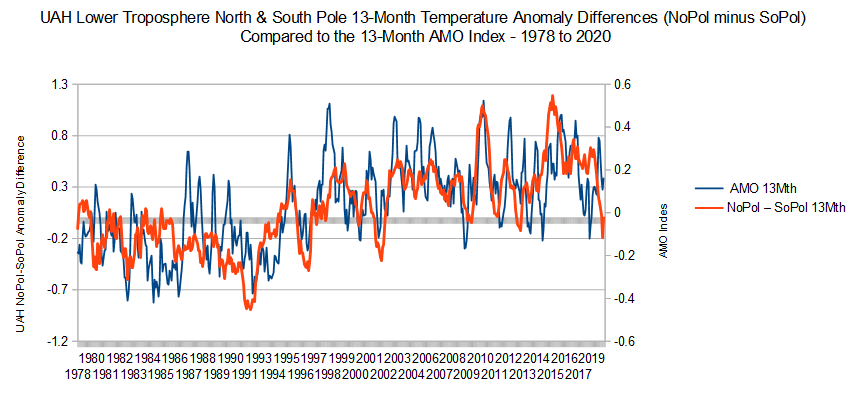 |
|
|
|
Post by duwayne on May 3, 2020 17:21:10 GMT
I'm still thinking about this one. But while I was thinking I started charting N. Pole and S. Pole temp. data. Kind of interesting. The bottom chart below shows 5-mth running averages. Note the S, Pole is relatively flat from 1978 to 2020, but with big swings in the later half. The N. Pole goes down through 1991 and then rises dramatically. Now really interesting. I take the difference of the 2 poles (NoPol minus SoPol) and plot it against the 13-Mth untrended AMO. Amazing fit. The last 4 months has been dramatically down. Shift? Adding a clearer chart showing the relationship between the difference in UAH Lower Troposphere temperature anomalies between the poles (13-month average) and the untrended AMO (13 Month avg.). The North Pole has really been dropping over the last 5 months. Are shifting back to the pole-to-pole relationships associated with a negative AMO? Note that April NAO (Azores-Iceland) hit a negative monthly record in April. If the AMO continues its 60-year cycle, it should be spending much of the next 30 years in negative territory. The small amount of global warming we've had will likely mean the values will not be quite as low as the last cycle. |
|
|
|
Post by nonentropic on May 3, 2020 18:58:15 GMT
beta.longpaddock.qld.gov.au/soi/Ratty your team is showing the way. SOI is lifting in a solid way will it keep going and usher in the La Nina and all that follows from there. I certainly hope so because the useful idiots are banging on about the warmest this and that and any snow or cold is just normal weather. Australia is cold currently and in a day we get to have their weather so good falls of snow promised. Its early very early and the ski fields are not opening till the virus is gone. You know the good news is and I say this carefully, if the fields open no queues, no Australian. Again its not about our neighbours its about the lift queue.
|
|
|
|
Post by acidohm on May 6, 2020 19:24:54 GMT
|
|
|
|
Post by missouriboy on May 6, 2020 19:52:25 GMT
Hard or soft?  |
|
|
|
Post by acidohm on May 6, 2020 20:35:46 GMT
Hard or soft? Honestly not sure. ENSO has seemed to have responded weakly to negative SOI pressure on El Nino, and now responding quickly to increasingly neutral SOI towards La Nina territory. |
|
|
|
Post by missouriboy on May 21, 2020 15:44:49 GMT
|
|
|
|
Post by missouriboy on May 23, 2020 3:00:09 GMT
If the SOI index continues its 22 day run for another 9 days (the 30-day running avg.) it will be the highest SOI since 2010. And we all remember the La Nina of 2010 ... and the two winters that followed. beta.longpaddock.qld.gov.au/soi/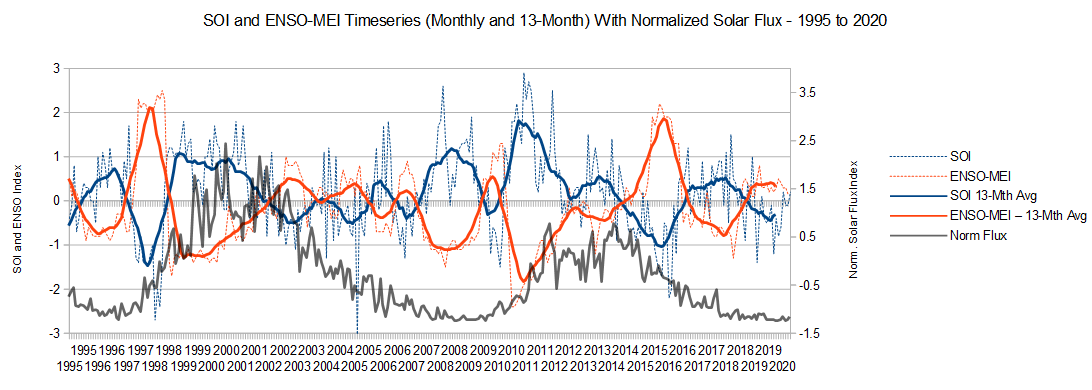 |
|
|
|
Post by Ratty on May 23, 2020 7:37:09 GMT
BoM OutlookThe 30-day Southern Oscillation Index (SOI) for the 30 days ending 10 May was +0.7. The 90-day value was −3.7. Both values are within the ENSO neutral range.Will be updated on 26 May.
|
|
|
|
Post by duwayne on May 23, 2020 19:59:59 GMT
The government agencies earlier had been showing a strong possibility of a la Nina later this year. Recently, they seem to have backed away from that prediction a bit. But this week’s large drop in weekly ONI from 0.2 to -0.3 confirms what Missouriboy said earlier about a possible la Nina.
It may not happen this time but at this time of the year in 1998 and 2010, the ONI was experiencing a precipitous drop which continued into la Nina territory. By year-end the numbers were showing super la Nina levels (-1.5)and the la Nina conditions continued throughout the following year.
For this to happen, it would seem like the SOI would need to swing strongly to the positive side reflecting stronger winds from the east to west across the Pacific Ocean.
|
|
|
|
Post by missouriboy on May 23, 2020 22:39:52 GMT
The government agencies earlier had been showing a strong possibility of a la Nina later this year. Recently, they seem to have backed away from that prediction a bit. But this week’s large drop in weekly ONI from 0.2 to -0.3 confirms what Missouriboy said earlier about a possible la Nina. It may not happen this time but at this time of the year in 1998 and 2010, the ONI was experiencing a precipitous drop which continued into la Nina territory. By year-end the numbers were showing super la Nina levels (-1.5)and the la Nina conditions continued throughout the following year. For this to happen, it would seem like the SOI would need to swing strongly to the positive side reflecting stronger winds from the east to west across the Pacific Ocean. As per what DuWayne said, the ONI table showing 1998-2020 is below. Unless SOI rapidly changes trend, there will be a strong positive May value. The ONI chart lags by 2 months. 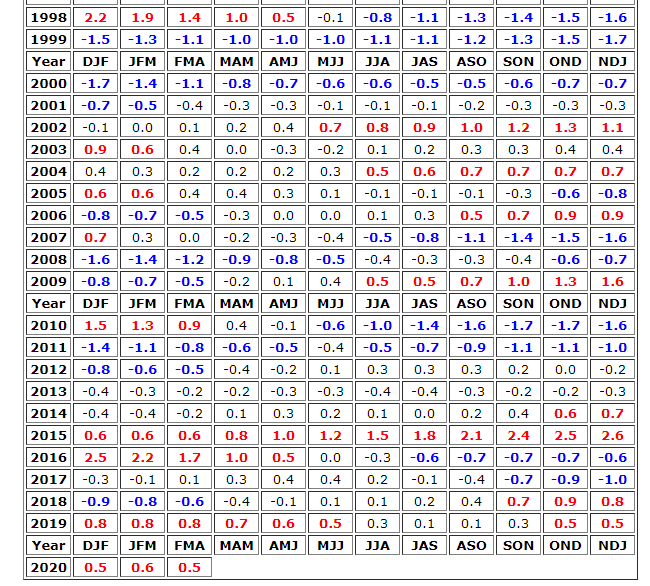 |
|
|
|
Post by acidohm on May 28, 2020 6:27:32 GMT
|
|