|
|
Post by missouriboy on Sept 6, 2020 22:21:38 GMT
Updated Charts for SOI, ENSO and UAH through August, 2020Through August, ENSO values have fallen to about -0.5 (Chart 1 and 2). UAH global and tropic temperatures appear to be ready to make a move lower over the next few months based on previous observations. 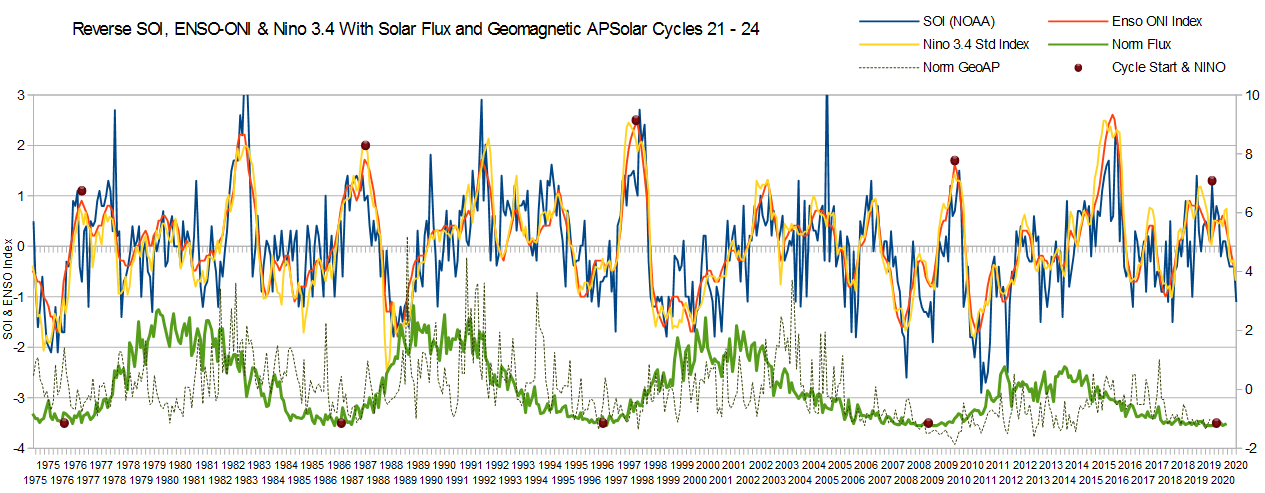 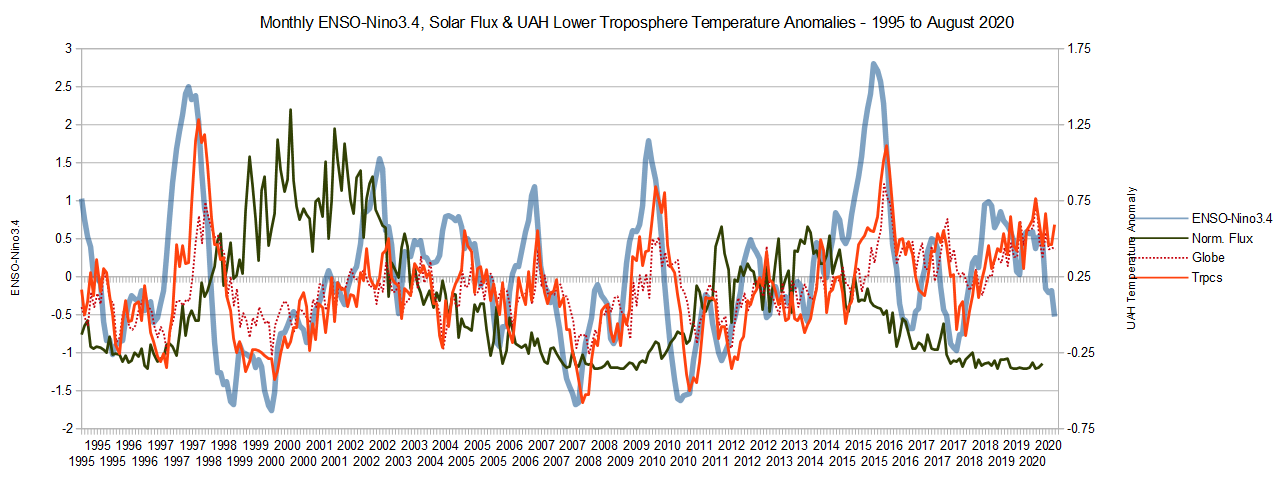
|
|
|
|
Post by nautonnier on Sept 9, 2020 15:55:00 GMT
IS it?
|
|
|
|
Post by acidohm on Sept 9, 2020 16:28:29 GMT
Yes, that "pacific is cooling" statement is overcooked a little! Still not sure La Nina is a done deal, technically. 5 months before designation and warm water building in the west |
|
|
|
Post by nautonnier on Sept 9, 2020 20:25:57 GMT
|
|
|
|
Post by missouriboy on Sept 9, 2020 20:48:02 GMT
Yes, that "pacific is cooling" statement is overcooked a little! Still not sure La Nina is a done deal, technically. 5 months before designation and warm water building in the west Either it will or it won't. Either it do or it don't. That kind of forecast should get me into a modeling club of some type.  Whole lot less evaporation likely coming off the Eastern Pacific. Any thoughts about a tie in with the massive monsoon this year? Atmospheric water vapor condensing and letting off a lot of heat. |
|
|
|
Post by acidohm on Sept 9, 2020 21:46:06 GMT
Yes, that "pacific is cooling" statement is overcooked a little! Still not sure La Nina is a done deal, technically. 5 months before designation and warm water building in the west Either it will or it won't. Either it do or it don't. That kind of forecast should get me into a modeling club of some type. Whole lot less evaporation likely coming off the Eastern Pacific. Any thoughts about a tie in with the massive monsoon this year? Atmospheric water vapor condensing and letting off a lot of heat. IOD and ENSO do correlate (seeing as they basically overlap/meet around Indonesia, or thereabouts. So Nino drys the Indian ocean air, nina wets it.....this effect also fills Australian reservoirs. My explanation is a little oversimplified.... |
|
|
|
Post by missouriboy on Sept 9, 2020 22:49:27 GMT
Either it will or it won't. Either it do or it don't. That kind of forecast should get me into a modeling club of some type. Whole lot less evaporation likely coming off the Eastern Pacific. Any thoughts about a tie in with the massive monsoon this year? Atmospheric water vapor condensing and letting off a lot of heat. IOD and ENSO do correlate (seeing as they basically overlap/meet around Indonesia, or thereabouts. So Nino drys the Indian ocean air, nina wets it.....this effect also fills Australian reservoirs. My explanation is a little oversimplified.... Did you find an actual IOD database (the real numbers)? I followed the link but couldn't find it at NASA or with a general search. First time I think I've heard that. Any links to papers, etc you can provide? That would help explain China mega-floods generally falling at the tail end of solar minimum. |
|
|
|
Post by glennkoks on Sept 9, 2020 23:43:08 GMT
The coldest winters in SE Texas were 1976, 1983, 1989. All La Nina years. It will be interesting to see how this year develops.
|
|
|
|
Post by missouriboy on Sept 10, 2020 0:50:11 GMT
The coldest winters in SE Texas were 1976, 1983, 1989. All La Nina years. It will be interesting to see how this year develops. Me thinks these CO2 trollers need to come up with a "better" technical term than teleconnections. It smacks of witchcraft.  |
|
|
|
Post by acidohm on Sept 10, 2020 5:05:03 GMT
IOD and ENSO do correlate (seeing as they basically overlap/meet around Indonesia, or thereabouts. So Nino drys the Indian ocean air, nina wets it.....this effect also fills Australian reservoirs. My explanation is a little oversimplified.... Did you find an actual IOD database (the real numbers)? I followed the link but couldn't find it at NASA or with a general search. First time I think I've heard that. Any links to papers, etc you can provide? That would help explain China mega-floods generally falling at the tail end of solar minimum. This is pretty good... www.climate.gov/news-features/blogs/enso/meet-enso%E2%80%99s-neighbor-indian-ocean-dipoleUnder first diagram there are positive/neutral/negative taps with corresponding change to diagram. Not sure if changes in convection/precipitation directly relate to weather over China as the dipole relates to oceanic areas rather then mainland. That said changes in synoptics in these areas likely have a knock on effect to those in adjacent areas. |
|
|
|
Post by Ratty on Sept 10, 2020 9:51:59 GMT
|
|
|
|
Post by missouriboy on Sept 10, 2020 16:29:03 GMT
Worth noting that the Nina at the start of SC24 lasted 22 months and the similarly located one for SC23 lasted close the 3 years. Their forecast is historically VERY short for similarly-located Ninas. |
|
|
|
Post by duwayne on Sept 10, 2020 17:08:48 GMT
Worth noting that the Nina at the start of SC24 lasted 22 months and the similarly located one for SC23 lasted close the 3 years. Their forecast is historically VERY short for similarly-located Ninas. Missouriboy, is it too early to make a prediction for 2031-2? |
|
|
|
Post by nautonnier on Sept 10, 2020 18:24:38 GMT
Worth noting that the Nina at the start of SC24 lasted 22 months and the similarly located one for SC23 lasted close the 3 years. Their forecast is historically VERY short for similarly-located Ninas. Missouriboy, is it too early to make a prediction for 2031-2? Ask Astromet - he probably has one.  |
|
|
|
Post by missouriboy on Sept 11, 2020 4:15:41 GMT
Worth noting that the Nina at the start of SC24 lasted 22 months and the similarly located one for SC23 lasted close the 3 years. Their forecast is historically VERY short for similarly-located Ninas. is that suppose to make me feel better? I thought that you liked snow. They aren't necessarily the best at forecasts, so you might consider employing a native to improve the odds. |
|


