|
|
Post by hilbert on May 8, 2009 20:46:07 GMT
The blackbody (or greybody) radiation law is used a lot in heat absorption/radiation calculations. Stephan-Boltzmann says that it goes as a*T^4. However, if T is not uniform, the parts that are above the average could emit substantially more. For example, if T' is 300 + 20 (Kelvin), a surface at 320 K would emit around 27% more energy than one at 300 K. Similarly, a surface at 280 K would emit about 27% less energy. Since this all uses the linear approximation for (1 + x)^4, everything works out, so that the average emitted energy is the same as if everything were at the average temperature.
Q: Has anyone worked out what the effect might be for including the higher order (non-linear) terms? Is is possible that having a non-uniform temperature distribution would give significant (several percent?) different total energy emission than just using the average temperature?
|
|
|
|
Post by hilbert on May 8, 2009 20:48:52 GMT
If the earth went into another mini ice age, what would it take to keep large regions of the earth heated up to "normal"? I suspect that even large numbers of fusion plants would not be sufficient; maybe gigantic solar collectors that beam down energy would do it--does anyone know?
|
|
|
|
Post by gettingchilly on May 8, 2009 22:55:58 GMT
It would take more than we have or could ever hope to have so buckle down and ride the wave and just tell everyone how warm it is.
|
|
|
|
Post by FineWino on May 9, 2009 0:10:42 GMT
The blackbody (or greybody) radiation law is used a lot in heat absorption/radiation calculations. Stephan-Boltzmann says that it goes as a*T^4. However, if T is not uniform, the parts that are above the average could emit substantially more. For example, if T' is 300 + 20 (Kelvin), a surface at 320 K would emit around 27% more energy than one at 300 K. Similarly, a surface at 280 K would emit about 27% less energy. Since this all uses the linear approximation for (1 + x)^4, everything works out, so that the average emitted energy is the same as if everything were at the average temperature. 320^4 is 29.4% greater than 300^4 280^4 is 24.2% less than 300^4. That is a significant difference. Using a linear approximation for a fourth order polynominal only makes sense for very small incremental changes. |
|
|
|
Post by hilbert on May 9, 2009 0:44:54 GMT
So, if the temperature is non-uniform, can we conclude that more power is radiated than would be expected for the average temperature? That sounds correct.
|
|
|
|
Post by steve on May 9, 2009 11:05:37 GMT
Q: Has anyone worked out what the effect might be for including the higher order (non-linear) terms? Is is possible that having a non-uniform temperature distribution would give significant (several percent?) different total energy emission than just using the average temperature? Yes. This is what the models aim to do. Also, the estimates of forcings of greenhouse gases are done using a suitably representative atmosphere including the cold poles and the hot tropics. |
|
|
|
Post by poitsplace on May 9, 2009 14:45:39 GMT
LOL, I don't suppose anyone's noticed all the crazyness.
Ocean heat content has DROPPED since the 1940's. The tell-tale signature of CO2 forcing is missing. The arctic sea ice melted like crazy while the antarctic sea ice expanded by more than the arctic lost... but now as the arctic recovers the water is for some reason warmer. The thermohaline circulation that they THOUGHT would be weakened by polar melting actually had some northern flows that had stopped functioning...start back up.
Are we sure we understand everything well enough to model it?
|
|
|
|
Post by steve on May 9, 2009 17:29:19 GMT
LOL, I don't suppose anyone's noticed all the crazyness. Ocean heat content has DROPPED since the 1940's. No it hasn't. It's risen. A lot. 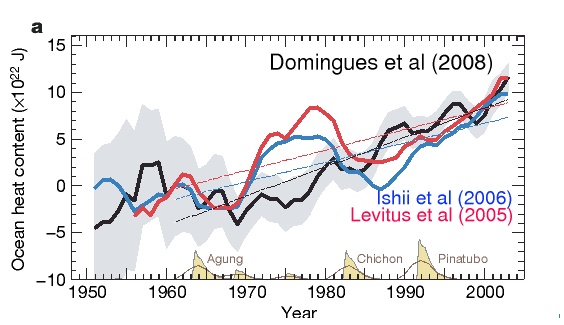 But assuming you were having a crack at the models, what you need to understand is that a model doesn't have to be perfect to be useful in helping answer many questions, one of which was the one above, another of which is what the weather is going to be like tomorrow... |
|
|
|
Post by poitsplace on May 9, 2009 19:12:09 GMT
LOL, I don't suppose anyone's noticed all the crazyness. Ocean heat content has DROPPED since the 1940's. No it hasn't. It's risen. A lot. But assuming you were having a crack at the models, what you need to understand is that a model doesn't have to be perfect to be useful in helping answer many questions, one of which was the one above, another of which is what the weather is going to be like tomorrow... You don't even need a computer to do short term weather forecasts so long as you have up to date information on where it's moving. The odds are pretty darned good that a 500 kilometer wide mass of cold air that's moving at 5mph will be 50 miles away in 10 hours. It's an entirely different thing to try to use that system to project what the global temperature will be in 10 years. All sorts of crazy things have happened that the models never predicted. The most important of those missed things that the models managed to NOT predict...was the global temperature just a few years later. It's really quite simple. Garbage went in...so we got garbage out. All of those things I mentioned were wrong and they're major issues. Using the data they used for those models is about like trying to repair a car by using a pogo stick manual as your guide. |
|
|
|
Post by icefisher on May 10, 2009 8:03:37 GMT
LOL, I don't suppose anyone's noticed all the crazyness. Ocean heat content has DROPPED since the 1940's. No it hasn't. It's risen. A lot. But assuming you were having a crack at the models, what you need to understand is that a model doesn't have to be perfect to be useful in helping answer many questions, one of which was the one above, another of which is what the weather is going to be like tomorrow... Hate to point it out but your graph does not have 1940 on it. These two graphs suggest maybe he is right.  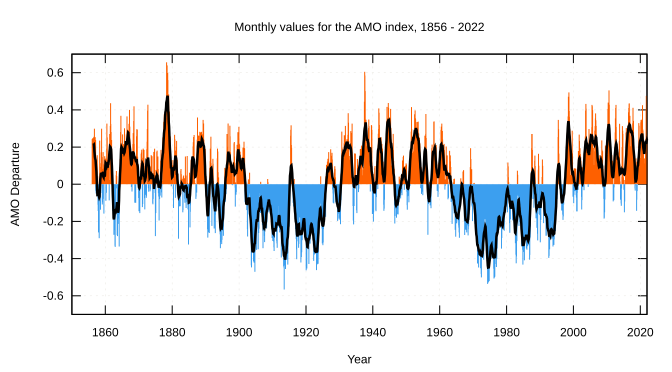 |
|
|
|
Post by socold on May 10, 2009 13:11:04 GMT
Uh AMO and PDO are related to sea surface temperature, not ocean heat content.
|
|
|
|
Post by julianb on May 10, 2009 13:36:42 GMT
|
|
|
|
Post by sigurdur on May 10, 2009 23:51:58 GMT
Being we are talking about the oceans, I would like to introduce this link as to the validity of the IPCC on sea levels. I wish more people would actually read the IPCC report. IT is so full of junk science it just isn't funny. Follow the money....follow the money......don't pay anyyyyyyy attention to the science....damn.....a shame that scientists can be bought so cheaply. www.climatechangefacts.info/ClimateChangeDocuments/NilsAxelMornerinterview.pdf |
|
|
|
Post by icefisher on May 11, 2009 1:40:35 GMT
Uh AMO and PDO are related to sea surface temperature, not ocean heat content. Quite right. But since ocean heat content hasn't been directly measured for long at all, the sea surface temps make for as good of a proxy as any for historical trends in ocean heat content. |
|
|
|
Post by hilbert on May 11, 2009 2:44:40 GMT
Does anyone know what Mars is doing, wrt warming/cooling?
|
|


