|
|
Post by rbateman on Jul 16, 2009 22:12:19 GMT
Duly noted, Craig.
I'm just hoping that someone will rise to the challenge and make a graph of the volcanoes intensity and plot them on the solar cycles so that we can see what's going on.
Anybody care to run with it?
|
|
|
|
Post by Ulric Lyons on Jul 17, 2009 10:56:05 GMT
This is somewhat of a diversion from my original post on this topic, which points out the relationship between volcanic eruptions, and solar driven rises in temperature at a monthly level, which could happen at any time in a solar cycle. Whether more happen at max. than min. is of less importance. I am though expecting some large temperature changes through cycle 24 max. in particular.
|
|
|
|
Post by Maui on Jul 17, 2009 16:38:14 GMT
A statistical proof is not possible due to lack of data. For example, Tambora volcano in Indonesia caused "the year with no summer" at the end of the Dalton minimum. But its last eruption date is "1987, plus or minus twenty years" due to lack of monitoring during civil war. Most of the Earth's volcanic activity is under the oceans, and there is almost zero information. Because these vents are so close to the mantle, they might feel the influence of the Sun most directly. Here is a graph from NASA's Solar Radiation and Climate Experiment (SORCE) Brochure. Note that the eruptions of Tambora, Krakatau, and @ 1980 El Chichon / Mt. St. Helens occurred during times of decreased solar irradiance:  By maui_67photos, shot with Canon EOS DIGITAL REBEL XT at 2009-07-17 |
|
|
|
Post by Maui on Jul 19, 2009 13:23:52 GMT
No comments?
No complaints?
Sorry for the poor quality; the caption reads: "After accounting for the increase in CO2 and other greenhouse gases, the Earth's surface temperature corresponds with the increase in solar radiation, except during major volcanic eruptions (arrows)." The graph shows irradiance (orange dots) and temperature: paleo reconstruction (blue slid line), NH instrumental (blue dashes). The arrows indicate Tambora, Coseguina, and Krakatoa. Produced by Judith Lean, Naval Research Laboratory.
(The partial graph on the left shows ozone versus solar UV varying on a monthly time scale; Lon Hood, U. Arizona.)
|
|
rmms
New Member

Posts: 8
|
Post by rmms on Jul 19, 2009 17:38:21 GMT
Nice job Maui but I found this correlation (St. Helens, Krakatoa, Tambora and so on) some years ago... Now I'm searching for other historical eruptions connected to solar minimum and awaiting some larger eruptions in future, if this minimum will last long enough. If I find some interesting info, I will post it here.
|
|
|
|
Post by donmartin on Jul 19, 2009 17:39:25 GMT
I have never run up Haleakala, but I did push a car to the top. That was in the age of carubretors.
Also, what is magnetism, and can fusion be described in any manner without reliance upon or recourse to particle theory?
|
|
|
|
Post by csspider57 on Jul 19, 2009 17:39:38 GMT
No comments? No complaints? Sorry for the poor quality; the caption reads: "After accounting for the increase in CO2 and other greenhouse gases, the Earth's surface temperature corresponds with the increase in solar radiation, except during major volcanic eruptions (arrows)." The graph shows irradiance (orange dots) and temperature: paleo reconstruction (blue slid line), NH instrumental (blue dashes). The arrows indicate Tambora, Coseguina, and Krakatoa. Produced by Judith Lean, Naval Research Laboratory. (The partial graph on the left shows ozone versus solar UV varying on a monthly time scale; Lon Hood, U. Arizona.) Just a casual observer here. But the Brochure is available as PDF online. That image is on page 3. lasp.colorado.edu/sorce/docs/reference/SORCE_Brochure_10_25_FINAL.pdfI am wondering what thoughts you may have on the following. We have charged particles at the North and South poles daily with varying intensities due to solar activity. (aurora) So, the sun and earth connect at our N. S. dipole regions. We also, have charged particles DAILY in the equatorial south west hemisphere. Daily examples: >300 keV Electrons (90° detector)  >6900 keV Protons (90° detector)  www.swpc.noaa.gov/tiger/index.html www.swpc.noaa.gov/tiger/index.htmllink to 'recent data plots,' on left. This would indicate a 3 points connection. Note that the above location is this planet South Atlantic Anomaly, where our magnetic field is weaker. So, another so called electro -magnetic connection here! It reminds me of Jupiters southern hemisphereic spot. I am wondering too if the angle indicates solar effects or galactic effects for both planets. Jupiters spot is now fading and its orbit is no longer on the heliospheres impact side location zone, where we interface with interstellar forces. The image below clearly shows more energetic values in the equatorial, as well as more southern.  This IBEX data image shows a dark sky map with the first orbit's coincidence counts from hydrogen atoms at speeds from about 100,000 to 36 million miles per hour. ...IBEX's two large-aperture detectors, IBEX-Lo and IBEX-Hi, measure energetic neutral atoms as they enter the solar system at speeds from about 100,000 mph to 36 million mph. The neutral atoms undergo a charge exchange process that converts them into ions, which the detectors then measure. IBEX-Lo measures lower-energy ENAs, while IBEX-Hi detects higher-energy ENAs www.nasa.gov/mission_pages/ibex/IBEXParticlesShedLight.html |
|
|
|
Post by Maui on Jul 20, 2009 16:05:41 GMT
Good luck to anyone who wants to study this. The truth about nuclear fusion is elusive. There are some philosophical considerations which explain why the idea of solar induction of nuclear fusion in volcanoes is not actively investigated.
Is the universe frequentist or Bayesian? The existence of Levy flights is evidence for the latter, but then you open the door to things like homeopathics and magic... Frequentist ideas permeate science; almost all computer models use random numbers or statistical analysis. Volcanic eruptions are not random but they appear to be chaotic.
Is the universe relativistic or virial? The former has to do with what happens when you blow everything to smithereens; the latter has to do with what holds everything together. Since Einstein's heyday, Americans have been obsessed with fears of nuclear catastrophe instead of hopes for world peace.
I had a lot of trouble with college physics because it relies so heavily on integral calculus (multiplying inputs times outputs). This seemed very consumption-oriented to me. I found that differential calculus was closer to nature, having to do with rates of change. Thus, one considers how fast resources are depleted instead of how much money can you make. Fourier's theory is perfect: everything is a wave.
(A personal note here: I was kicked out of Cornell in 1892 by a psychologist after I told her I thought I could control volcanoes and cause an ice age. She told my parents either come from Hawaii to get me or they would send me to Tompkins County Hospital. On the flight home I noticed a strange cloud; in Honolulu, everyone was talking about the atmospheric change from EL Chichon's eruption. A few months later, the Hawaiian Islands were hit by an unusual hurricane. When one has an intuitive understanding of natural processes, cause and effect become blurred...
I only passed one course that semester: Prof. David Pimentel's "Agriculture, Society and the Environment" seminar; he gave me a "B." I did not return to Cornell, and missed out on his "Environmental Consequences of Nuclear War" seminar in fall of 1982, which refined the concept of nuclear winter. Instead, I got married and lived in Hawaii for twenty more years.)
|
|
|
|
Post by brokenheadphonez on Jul 20, 2009 20:29:14 GMT
Everyone thinks I'm crazy because they're too ignorant/incapable/unwilling to put in any research themselves.
I didn't ask for these abilities, but hey - might as well use them..
|
|
|
|
Post by Maui on Jul 21, 2009 16:01:21 GMT
Headphonez--scientists in Iran and Russia seem to be researching this.
I am very lucky to have that NASA SORCE brochure. My wife and I went to San Francisco in September, 2006, for a vacation, and as always when I travel I tried to do some research. I went to UC Berkeley, but was totally intimidated by the library so I went to the bookstore. There was a profusion of books on string theory but nothing else exciting (except a civil engineering handbook for two hundred bucks). Anyway, we returned home and back to work and--SURPRISE--there was a whole NASA solar-terrestrial physics conference at the hotel where I worked. Many of the attendees were from far away and arrived by seaplane, so I was responsible for driving them around the resort and had opportunity to pitch my ideas.
These people are not ignorant; narrow-minded and worried about their jobs is more like it. SORCE has a vested interest in showing that the Sun directly affects climate. Space-based projects take years to plan and execute; it is hard to change course mid-stream if there are new ideas to investigate. For example, one of the reasons there was a big delay in a Martian mission recently had to do with controversy about where the thing lands in relation to recently discovered (possible) volcanic methane sources. When other problems appeared, there was a rare opportunity to adjust the mission.
NASA people work for the government. If you are interested in volcanic nuclear fusion, your first question should involve chemical evidence and tritium. Good luck at getting answers. Of course, you could go to Iran or Russia...
|
|
|
|
Post by brokenheadphonez on Jul 23, 2009 14:52:40 GMT
Hey Maui, yeah the thing is - it's ALL important! The solar research is important, the big picture is important.. I keep being reminded I think it was Doc S. who said "follow the money" haha!
I don't think being wrong is a failure. I've noticed the Russians are on to something. I tried to message you on gmail chat, super busy - will fill you in later!
It's like I told my friend: It's the Russian! He's so brilliant and he has this understanding of everything but then he just ends it with something f**kin crazy!"
My friend's like: "Yeah, he's Russian!"
|
|
|
|
Post by nobrainer on Jul 23, 2009 16:00:04 GMT
No comments? No complaints? Sorry for the poor quality; the caption reads: "After accounting for the increase in CO2 and other greenhouse gases, the Earth's surface temperature corresponds with the increase in solar radiation, except during major volcanic eruptions (arrows)." The graph shows irradiance (orange dots) and temperature: paleo reconstruction (blue slid line), NH instrumental (blue dashes). The arrows indicate Tambora, Coseguina, and Krakatoa. Produced by Judith Lean, Naval Research Laboratory. (The partial graph on the left shows ozone versus solar UV varying on a monthly time scale; Lon Hood, U. Arizona.) Just a casual observer here. But the Brochure is available as PDF online. That image is on page 3. lasp.colorado.edu/sorce/docs/reference/SORCE_Brochure_10_25_FINAL.pdfI am wondering what thoughts you may have on the following. We have charged particles at the North and South poles daily with varying intensities due to solar activity. (aurora) So, the sun and earth connect at our N. S. dipole regions. We also, have charged particles DAILY in the equatorial south west hemisphere. Daily examples: >300 keV Electrons (90° detector) >6900 keV Protons (90° detector) www.swpc.noaa.gov/tiger/index.htmllink to 'recent data plots,' on left. This would indicate a 3 points connection. Note that the above location is this planet South Atlantic Anomaly, where our magnetic field is weaker. So, another so called electro -magnetic connection here! It reminds me of Jupiters southern hemisphereic spot. I am wondering too if the angle indicates solar effects or galactic effects for both planets. Jupiters spot is now fading and its orbit is no longer on the heliospheres impact side location zone, where we interface with interstellar forces. The image below clearly shows more energetic values in the equatorial, as well as more southern. This IBEX data image shows a dark sky map with the first orbit's coincidence counts from hydrogen atoms at speeds from about 100,000 to 36 million miles per hour. ...IBEX's two large-aperture detectors, IBEX-Lo and IBEX-Hi, measure energetic neutral atoms as they enter the solar system at speeds from about 100,000 mph to 36 million mph. The neutral atoms undergo a charge exchange process that converts them into ions, which the detectors then measure. IBEX-Lo measures lower-energy ENAs, while IBEX-Hi detects higher-energy ENAs www.nasa.gov/mission_pages/ibex/IBEXParticlesShedLight.htmlInteresting images...here is another that looks close. Its the world grid...a theory on laylines etc. seems to line up reasonably close. 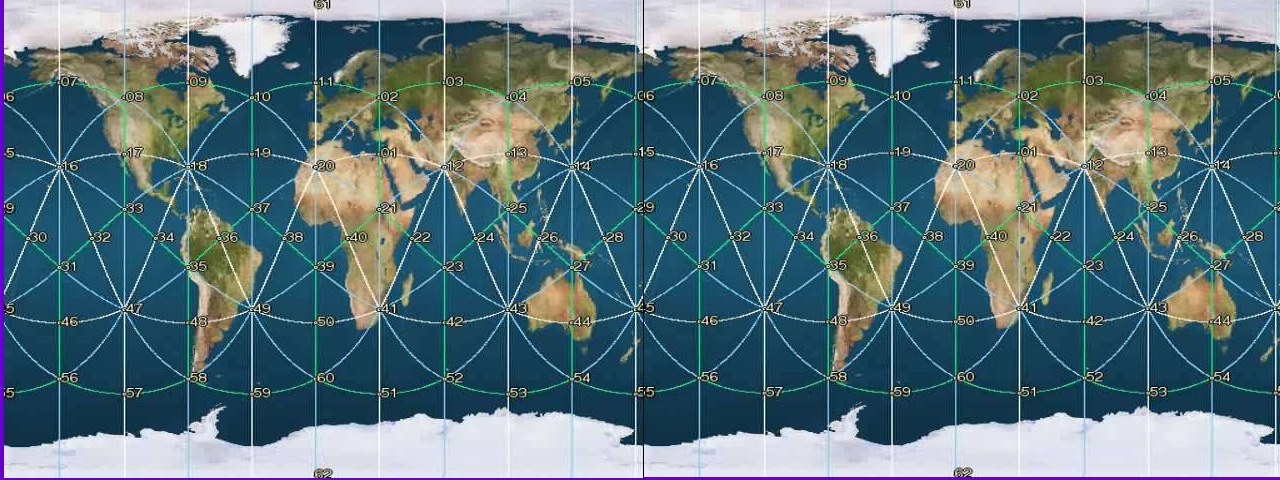 |
|
|
|
Post by brokenheadphonez on Jul 23, 2009 16:30:24 GMT
Wow I'm right smack dab in the middle of one of those "grids"
|
|
|
|
Post by nobrainer on Jul 24, 2009 0:25:15 GMT
Some have suggested an atomic weapon cannot detonate unless its close to a line. I overlayed a map of all 2000 odd detonations and also checked on google earth and it would seem that they all occur near or on a line.
|
|
|
|
Post by brokenheadphonez on Jul 24, 2009 20:04:47 GMT
No detonation at all? Or do they fizzle?
|
|

