|
|
Post by gdfernan on Sept 2, 2009 16:24:27 GMT
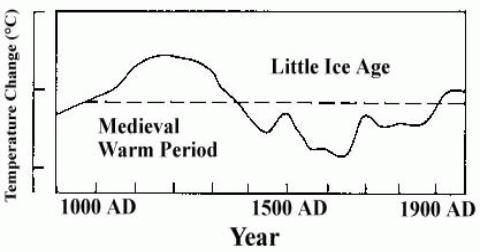
The Medieval Warm Period (MWP) which was abolished by the AGW crowd seems to have been rehabilited. wattsupwiththat.com/2009/09/02/woods-hole-embraces-the-medieval-warm-period-contradict-manns-proxy-data/A breif primer on MWP. It was widely accepted that MWP existed as a world wide event resulting in global temperatures being equal to or greater than the current levels. This was even accepted by the uber warmists at the IPCC who included the following chart in their 1990 report www.climateaudit.org/?p=3072However, the alarmists realised that it was difficult to sell warming as being caused by technological man-made emissions when the earth seems capable of doing it on its own. The infamous email quoted by Dr David Deming where a prominent AGWer is supposed to have said "We have to get rid of MWP" is evidence of this panic. See link below (abt 1/3rd way down) climate.blog.co.uk/2006/11/11/lying_made_easy~1318827/So the AGWers got rid of MWP by using the, at that time, unpublished dissertation of Michael Mann which propounded the infamous "Hockey Stick". This was excrociated by Steve McIntyre at Climateaudit.org and totally discredited. After obtaining the code used to generate the hockey stick, Steve showed that even when random numbers were fed in, it still generated a Hockey Stick. However, the mainstream AGWers still stuck to the Hockey Stick with even Al Gore and other useful idiots using this chart in their presentations. Meanwhile in the real world, true scientists kept plugging away at the MWP conundrum with www.co2science.org/index.php collecting several hundred research papers that show the MWP in all continents. All of those scientists can now feel vindicated that in institution such as Woods Hole now endorses their work. CRACKS are widening in the AGW coalition. Hopefully it will fall apart before the politicians impose draconian legislation (Cap & Trade) that will destroy Western economies and ultimately lead to the decline of the Western civilisation. |
|
|
|
Post by sigurdur on Sept 2, 2009 16:55:37 GMT
The Medieval Warm Period (MWP) which was abolished by the AGW crowd seems to have been rehabilited. wattsupwiththat.com/2009/09/02/woods-hole-embraces-the-medieval-warm-period-contradict-manns-proxy-data/A breif primer on MWP. It was widely accepted that MWP existed as a world wide event resulting in global temperatures being equal to or greater than the current levels. This was even accepted by the uber warmists at the IPCC who included the following chart in their 1990 report www.climateaudit.org/?p=3072However, the alarmists realised that it was difficult to sell warming as being caused by technological man-made emissions when the earth seems capable of doing it on its own. The infamous email quoted by Dr David Deming where a prominent AGWer is supposed to have said "We have to get rid of MWP" is evidence of this panic. See link below (abt 1/3rd way down) climate.blog.co.uk/2006/11/11/lying_made_easy~1318827/So the AGWers got rid of MWP by using the, at that time, unpublished dissertation of Michael Mann which propounded the infamous "Hockey Stick". This was excrociated by Steve McIntyre at Climateaudit.org and totally discredited. After obtaining the code used to generate the hockey stick, Steve showed that even when random numbers were fed in, it still generated a Hockey Stick. However, the mainstream AGWers still stuck to the Hockey Stick with even Al Gore and other useful idiots using this chart in their presentations. Meanwhile in the real world, true scientists kept plugging away at the MWP conundrum with www.co2science.org/index.php collecting several hundred research papers that show the MWP in all continents. All of those scientists can now feel vindicated that in institution such as Woods Hole now endorses their work. CRACKS are widening in the AGW coalition. Hopefully it will fall apart before the politicians impose draconian legislation (Cap & Trade) that will destroy Western economies and ultimately lead to the decline of the Western civilisation. Gosh.....I have missed something. I didn't think anyone, who had even a shroud of inteligence, didn't think the MWP existed. There is proof throughout the world on that one. You are kidding....right? I mean, other than Mann who wouldn't know sound science if it was perched on his nose. |
|
|
|
Post by nautonnier on Sept 2, 2009 17:15:02 GMT
Gosh.....I have missed something. I didn't think anyone, who had even a shroud of inteligence, didn't think the MWP existed. There is proof throughout the world on that one. You are kidding....right? I mean, other than Mann who wouldn't know sound science if it was perched on his nose. Several of the well known posters on this site have claimed that the Medieval Warm Period was purely a European phenomenon - same for the Little Ice Age. That is why such collations of research papers are important. So we are now back to 'the Earth can do this on its own'. This means that the IPCC logic - 'we can only think of CO2 as a reason that the Earth is warming' has now got a problem. |
|
|
|
Post by sigurdur on Sept 2, 2009 17:45:56 GMT
Gosh.....I have missed something. I didn't think anyone, who had even a shroud of inteligence, didn't think the MWP existed. There is proof throughout the world on that one. You are kidding....right? I mean, other than Mann who wouldn't know sound science if it was perched on his nose. Several of the well known posters on this site have claimed that the Medieval Warm Period was purely a European phenomenon - same for the Little Ice Age. That is why such collations of research papers are important. So we are now back to 'the Earth can do this on its own'. This means that the IPCC logic - 'we can only think of CO2 as a reason that the Earth is warming' has now got a problem. The history of AGW for those who don't know started with Margaret Thatcher wanting more nuclear plants in Briton. AGW has never been credible when one starts examining the scientific basis for it. I will admit, I was taken in for years reading only the local paper etc. However, once I started reading the papers supposedly supporting AGW, I realized that something was very amiss, credibility. There is an old saying.....fool a fool once.....well, I have grown to be over being the fool. Won't happen again. |
|
|
|
Post by neilhamp on Sept 2, 2009 18:09:25 GMT
Craige Lochle published a paper in 2006 entitled “Global Temperature reconstructions based upon non tree ring proxies”. He examined 18 non tree-ring studies from different parts of the world. www.ncasi.org/publications/Detail.aspx?id=3025 |
|
|
|
Post by socold on Sept 2, 2009 19:08:30 GMT
|
|
|
|
Post by sigurdur on Sept 2, 2009 19:14:31 GMT
SoCold:
You said that in the past as we talked about it.
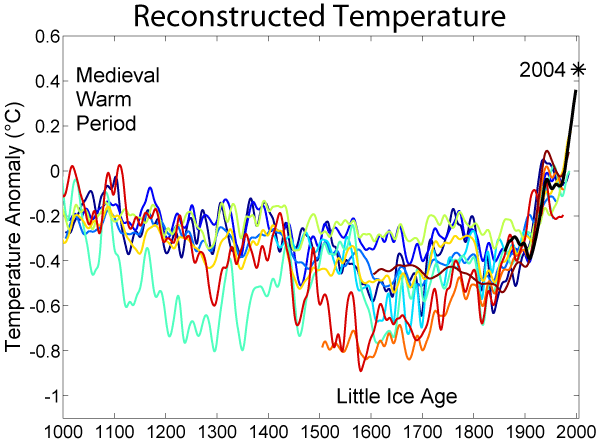
The graph you posted is in error by the way. The accepted science is that the MWP was about .3C warmer than present temps. I don't see that in your graph.
But that's ok.....you will be catching on pretty quickly. I still think Margaret Thatcher was a loon to have started all of this.
|
|
|
|
Post by socold on Sept 2, 2009 19:46:37 GMT
SoCold: You said that in the past as we talked about it. The graph you posted is in error by the way. The accepted science is that the MWP was about .3C warmer than present temps. I don't see that in your graph. Clearly the authors of the papers that make up my graph don't accept the MWP was about .3C warmer than present. That's one of many theories frankbi.files.wordpress.com/2009/02/agw-conspiracy-20090201-1.png |
|
|
|
Post by icefisher on Sept 2, 2009 19:58:14 GMT
Clearly the authors of the papers that make up my graph don't accept the MWP was about .3C warmer than present. Thats because your authors are science deniers. You have to be to hold on to a single bristlecone pine record and ignore the dozens of other proxies out there. Its like the action of a religious zealot. |
|
|
|
Post by sigurdur on Sept 2, 2009 20:01:55 GMT
SoCold: You said that in the past as we talked about it. The graph you posted is in error by the way. The accepted science is that the MWP was about .3C warmer than present temps. I don't see that in your graph. Clearly the authors of the papers that make up my graph don't accept the MWP was about .3C warmer than present. That's one of many theories frankbi.files.wordpress.com/2009/02/agw-conspiracy-20090201-1.pngAnd the authors of the papers supporting that graph are wrong. Wouldn't be the 1st time. I like the head of the AGW conspiracy.....Greenies are Commies....LOL. That is a good one. You can't get much greener than I am. I recycle everything....conserve wherever and whenever I can. Just good economics and also understand that recources are finite. And I am conservative. OH well, another hole in those conspiracy cases. |
|
|
|
Post by socold on Sept 2, 2009 20:32:52 GMT
Clearly the authors of the papers that make up my graph don't accept the MWP was about .3C warmer than present. Thats because your authors are science deniers. You have to be to hold on to a single bristlecone pine record and ignore the dozens of other proxies out there. Its like the action of a religious zealot. They didn't use a "single bristlecone pine record". Besides the fact is that the papers that make up my graph didn't find that the MWP was about .3C warmer than present. The best you can do is write it off as a conspiracy and call those scientists liars. You certainly can't get away with claiming those scientists think the MWP was 0.3C warmer than today though. |
|
|
|
Post by radiant on Sept 2, 2009 21:14:10 GMT
Does anybody know why the 1996 IPCC report decided the chart looked like this?  Where did the data from that come from? |
|
|
|
Post by sigurdur on Sept 2, 2009 21:23:33 GMT
Does anybody know why the 1996 IPCC report decided the chart looked like this?  Where did the data from that come from? Thank you Radiant. I was going to bring that up!.... |
|
|
|
Post by socold on Sept 2, 2009 21:58:16 GMT
The IPCC graph you are thinking of was in the 1990 report only.  The origins of the image in the IPCC 1990 report is laid out on this climate audit thread: www.climateaudit.org/?p=3072I am interested in why the graph you posted is slightly different, specifically at the end. Where did you find that graph? |
|
|
|
Post by glc on Sept 2, 2009 22:04:02 GMT
Where did the data from that come from?
Good question, Radiant, where did the data come from. I'm a bit surprised at you posting that graph. After all, you don't trust the measurements from a network of thousands of stations or from MSUs aboard orbiting satellites, but you happily post what, to be frank, looks like a child's drawing.
|
|


