|
|
Post by nautonnier on Dec 28, 2012 9:28:41 GMT
I hope someone archives that page so it can be played back to them this time next year. I don't suppose anyone has the equivalent forecast made last year? Rhetorical Last year they forecast: "4 January 2012 - 2012 is expected to be around 0.48 °C warmer than the long-term (1961-1990) global average of 14.0 °C, with a predicted likely range of between 0.34 °C and 0.62 °C, according to the Met Office annual global temperature forecast. "www.metoffice.gov.uk/news/releases/archive/2011/2012-global-temperature-forecastSo now we will have to await the figures for 2012. |
|
|
|
Post by throttleup on Dec 28, 2012 16:12:22 GMT
thermostat may have a point.
If you take this graph and rotate it 90 degrees counter-clockwise, global temps ARE going straight up. Somebody open a window... Somebody open a window...
|
|
|
|
Post by sigurdur on Dec 28, 2012 16:20:59 GMT
|
|
|
|
Post by cuttydyer on Dec 28, 2012 21:24:10 GMT
So now we will have to await the figures for 2012. Well, it’s been a cold wet 2012 in the UK: Current CET Met data: • Average so far this year o Average CET to November: 10.15 o Normal CET to November: 9.91 (data from 1772 so includes 78 years of the "Little Ice Age") o Anomaly to November: 0.23 o Provisional CET anomaly (up to 27th December): 0.20 MetOffice CET (Central England Temp) data can be found here: www.metoffice.gov.uk/hadobs/hadcet/cet_info_mean.htmlTrend since 1997: 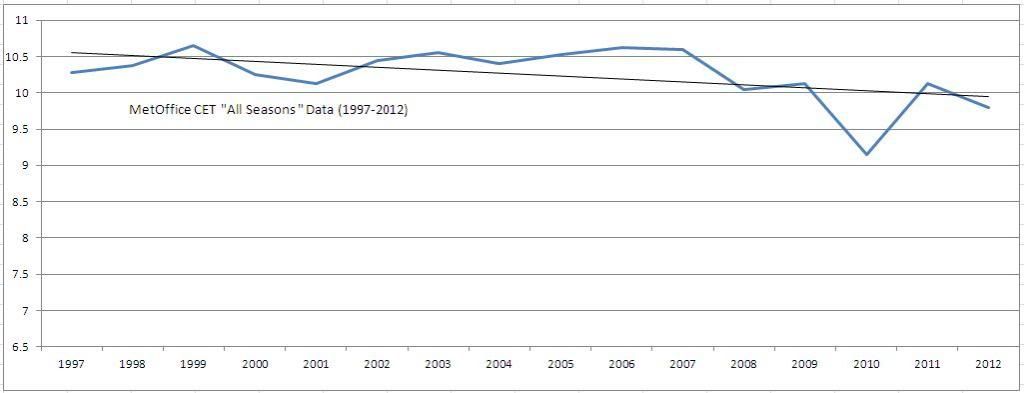 Data downloaded from: www.metoffice.gov.uk/hadobs/hadcet/data/download.html |
|
|
|
Post by karlox on Dec 28, 2012 22:43:06 GMT
The third wettest autumn in one century in Spain. (source link below, includes chart) 27/12/2012 Last fall was very wet with an average rainfall around 265 mm, 43% more than normal, making it the third wettest this century after the years 2003 and 2006. In temperatures, the quarter has been slightly warmer. temperatures: The September-November quarter of 2012 has been set slightly warmer than normal, with an average temperature of Spain as a whole of 16.0 ° C, which is 0.5 ° C above the normal mean value (reference period 1971-2000). www.aemet.es/es/noticias/2012/12/climatolotono12 |
|
|
|
Post by sigurdur on Dec 29, 2012 0:31:29 GMT
One thing that is important in trend analysis is to recognize when a trend has changed.
To me, it is very obvious that the trend has changed to one of cooling. When looking at karlox's link to spain weather, the base period for the anamoly is 1971-2000. This was a warm period. Started out cooler, then warmed consistently.
The anamolies need to be changed to 1981-2011 for them to show recent temperatures.
And on a 5 year anamoly, this is the most useful to detect short term changes.
As shown in the trend from the Met Office, england has been cooling for well over a decade now.
Now the question begs, when a cooling period in the past was presented, what did it do to the weather patterns?
I am familiar with Upper Midwest CONUS, but not at all with Europe, China etc.
Can folks who live there do a bit of research and share with the rest of us?
I find this topic most interesting.
|
|
|
|
Post by magellan on Dec 29, 2012 2:05:41 GMT
www1.ncdc.noaa.gov/pub/data/cmb/bams-sotc/climate-assessment-2008-lo-rez.pdfNear-zero and even negative trends are common for intervals of a decade or less in the simulations, due to the model’s internal climate variability. The simulations rule out (at the 95% level) zero trends for intervals of 15 yr or more, suggesting that an observed absence of warming of this duration is needed to create a discrepancy with the expected present-day warming rate. Maybe Dr. Thermobrag can grace us with his scientific prowess and explain this apparent discrepancy. One could note when that document was written, it had been about 10 years already, so the nation's top scientists were looking for an out to CTA and arbitrarily pulled the number 15 out of their posterior. Now it will be 20 years.
|
|
|
|
Post by sigurdur on Dec 29, 2012 2:31:25 GMT
magellan:
It won't make any difference now how long a period they want it to be.
We are cooling.....like it or not that is reality.
|
|
|
|
Post by cuttydyer on Dec 29, 2012 8:16:57 GMT
My father was staying with me over Christmas; our conversation turned to the weather and we talked about the changes he has seen to UK weather over the last 78 years. We decided to test his recollections by plotting the MET CET temperature data from his birth to present day; we found three trends that matched his memories: 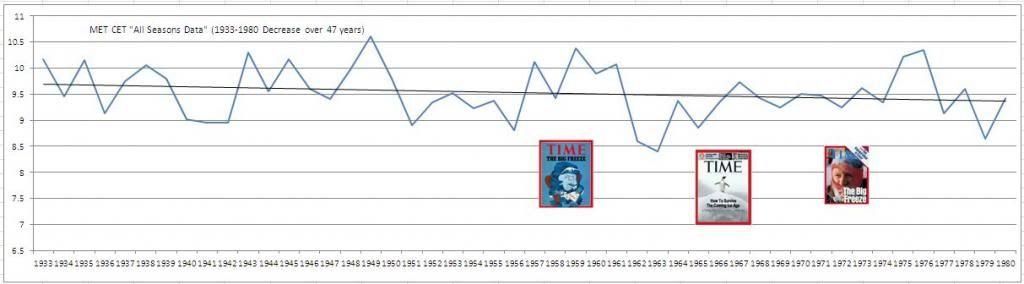 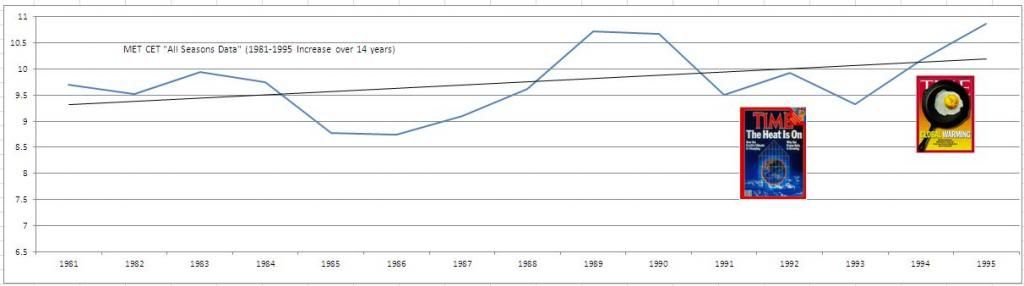 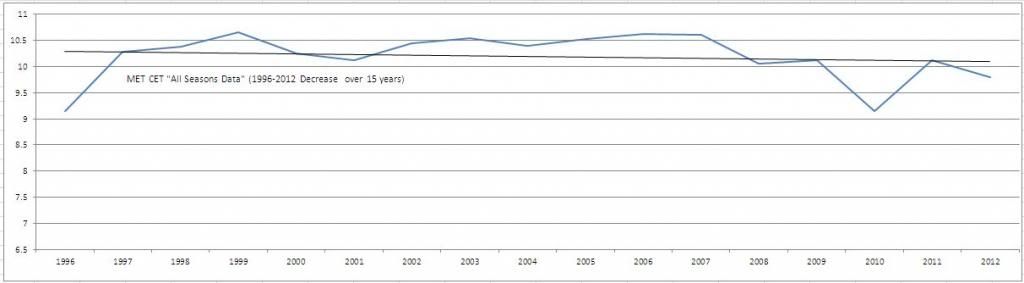 (Added Time covers as he recalled the 1970's ice age concerns) So, for 80% of my Father's life he's witnessed a cooling trend punctuated by a brief but potent 14 year rise in temps. Data downloaded from: www.metoffice.gov.uk/hadobs/hadcet/data/download.htmlNow the question begs, when a cooling period in the past was presented, what did it do to the weather patterns? I am familiar with Upper Midwest CONUS, but not at all with Europe, China etc. Can folks who live there do a bit of research and share with the rest of us? I find this topic most interesting. Sigurdur, It’s of great interest to me also; found this site containing historical weather references: booty.org.uk/booty.weather/climate/histclimat.htm |
|
|
|
Post by nautonnier on Dec 29, 2012 12:06:59 GMT
www1.ncdc.noaa.gov/pub/data/cmb/bams-sotc/climate-assessment-2008-lo-rez.pdfNear-zero and even negative trends are common for intervals of a decade or less in the simulations, due to the model’s internal climate variability. The simulations rule out (at the 95% level) zero trends for intervals of 15 yr or more, suggesting that an observed absence of warming of this duration is needed to create a discrepancy with the expected present-day warming rate. Maybe Dr. Thermobrag can grace us with his scientific prowess and explain this apparent discrepancy. One could note when that document was written, it had been about 10 years already, so the nation's top scientists were looking for an out to CTA and arbitrarily pulled the number 15 out of their posterior. Now it will be 20 years. I bet those posteriors are being kicked now, as that quote is coming back to bite NOAA's collective posterior.
However - I must admit I find this attitude puzzling. We were told by Hansen et al that the world was heading for catastrophe so great that the human race was in danger of extinction with the rest of 'nature with Earth turning into a barren planet like Mars. Now we have excellent news that this is not happening; the models are wrong; humanity and nature are saved!!!. And yet these 'scientists' and politicians are disappointed to the extent that they argue that "no no it is still warming!"- and they even adjust temperature records to make current temperatures look warmer?? What kind of people are they - do they really want catastrophe? Or is it really that they are making a nice living out of being climate Jeremiahs and they don't want their trough taken away? And I should not need to remind you that as Hansen is making a fortune out of being a climate Cassandra while still being paid by NASA - a child dies every 5 seconds from hunger. They obviously have their own priorities. |
|
|
|
Post by throttleup on Dec 29, 2012 16:57:10 GMT
www1.ncdc.noaa.gov/pub/data/cmb/bams-sotc/climate-assessment-2008-lo-rez.pdfNear-zero and even negative trends are common for intervals of a decade or less in the simulations, due to the model’s internal climate variability. The simulations rule out (at the 95% level) zero trends for intervals of 15 yr or more, suggesting that an observed absence of warming of this duration is needed to create a discrepancy with the expected present-day warming rate. Maybe Dr. Thermobrag can grace us with his scientific prowess and explain this apparent discrepancy. One could note when that document was written, it had been about 10 years already, so the nation's top scientists were looking for an out to CTA and arbitrarily pulled the number 15 out of their posterior. Now it will be 20 years. I bet those posteriors are being kicked now, as that quote is coming back to bite NOAA's collective posterior.
However - I must admit I find this attitude puzzling. We were told by Hansen et al that the world was heading for catastrophe so great that the human race was in danger of extinction with the rest of 'nature with Earth turning into a barren planet like Mars. Now we have excellent news that this is not happening; the models are wrong; humanity and nature are saved!!!. And yet these 'scientists' and politicians are disappointed to the extent that they argue that "no no it is still warming!"- and they even adjust temperature records to make current temperatures look warmer?? What kind of people are they - do they really want catastrophe? Or is it really that they are making a nice living out of being climate Jeremiahs and they don't want their trough taken away? And I should not need to remind you that as Hansen is making a fortune out of being a climate Cassandra while still being paid by NASA - a child dies every 5 seconds from hunger. They obviously have their own priorities. |
|
|
|
Post by karlox on Dec 30, 2012 11:05:42 GMT
|
|
|
|
Post by sigurdur on Dec 30, 2012 17:07:48 GMT
karlox:
We better be glad that the oceans absorbed some warmth. That is a LOT of heat that is in a position to leave.......and leave fast.
|
|
|
|
Post by magellan on Dec 30, 2012 17:11:30 GMT
|
|
|
|
Post by karlox on Dec 30, 2012 19:57:15 GMT
Thanks again Magellan! From the link: The effects of a SSW can be transmitted into the troposphere as the propagation of the SSW occurs and this can have a number of consequences. There is a higher incidence of northern blocking after SSW’s but we are all aware that not every SSW leads to northern blocking. Any northern blocking can lead to cold air from the tropospheric Arctic flooding south and colder conditions to latitudes further south can ensue. There is often thought to be a time lag between a SSW and northern blocking from any downward propagation of negative mean zonal winds from the stratosphere. This has been quoted as up to 6 weeks though it can be a lot quicker if the polar vortex is ripped in two following a split SSW. |
|


