|
|
Post by missouriboy on Feb 10, 2019 5:21:22 GMT
So what happened in the 'great climate shift' 0f 1976 and onward? The oceans the Pacific with El Nino and the Atlantic with AMO warm started dumping heat into the atmosphere, cheering from the alarmists about the rise in temperatures. This happened in several steps warm SST -> hotter atmosphere So repeat that - Heat leaving the ocean to the atmosphere where inevitably it goes to space. The comments we have from people like Joe Bastardi are that cooling will 'take some time as the oceans have to lose their heat' - but that is what we have been watching since 1976. [ Snip ] Could we have been watching the oceans cooling for the past 40 years or so and not realized it? Now that the Sun has gone quiet perhaps there is not sufficient short wave energy to keep up with the ocean heat loss. Or to put it another way, could the atmospheric temperatures drop faster than people expect as the surplus heat has already mainly left the oceans? I, for one, hope it is a quick descent so I will have time to tell a few people " I told you so!" (Sorry Sig.) Once the scam was exposed, a quick rise back to Goldilocks climate levels would be appreciated. I don't know Ant. I think that Naut may have a good point there. Consider the following. If ENSO is a reasonable measure of what the tropical oceanic heat engine is pumping out (and it spreads north and south around the gyres), look at the trend in ENSO values in comparison to the Solar Flux and geomagnetic activity (chart1), ENSO slopes upward to the end of SC19 when the geomagnetic index crashes for 12 years. ENSO continues to pump out the heat through SC20 when it drops into that God awful deep long La Nina of 1973-75. The coldest winters in our Midwest times series occurred during and after this event. Now compare this to what happened at the end of SC23. AP index crashes and it has been hugging bottom through SC24. The two coldest winters, 1962-63 and 2009-10 occurred when the AP index hit bottom before the start of the next cycle. ENSO continued to pump out the heat until SC24 kicked in. There was a big nino on the down side of low cycle 19. There was a bigger nino on the down side of low cycle 24. Our star kicked back into gear for SC21 and you can see the increase in geomagnetic activity that preceded that jump start. We haven't seen any dramatic increase in that AP activity in the dying parts of this cycle. What do you suppose is going to happen to those oceanic temperatures (and the land temperatures they support) if we don't get a big kick off into SC25? That large nina Astro is talking about might be cooked into the books regardless. Just look at 73-75. If you believe the CET temperatures, they have been holding more or less through the pause, but they are starting to crack it appears. The American north country has been slowing cracking for the last decade. In chart 2, look at the big spikey placements of those Ninos preceding solar cycle kick ins, and the corresponding magnitude in the crash of the SOI that is not as strongly replicated in Ninos following solar cycles. Perhaps this was Astro's point. While NOAA calls anything in their blocks exceeding 0.5 C for a specified period of time a Nino, the ones following solar cycles may be just bleeding off heat minus the large atmospheric push. I still wonder if we may still be missing another oceanic transfer of heat from south to north or north to south that helps explain the shifts. Seems to me that we might see mid-1970s temperatures again by 2022? And if SC25 comes in cold, that bloody heat will keep bleeding? 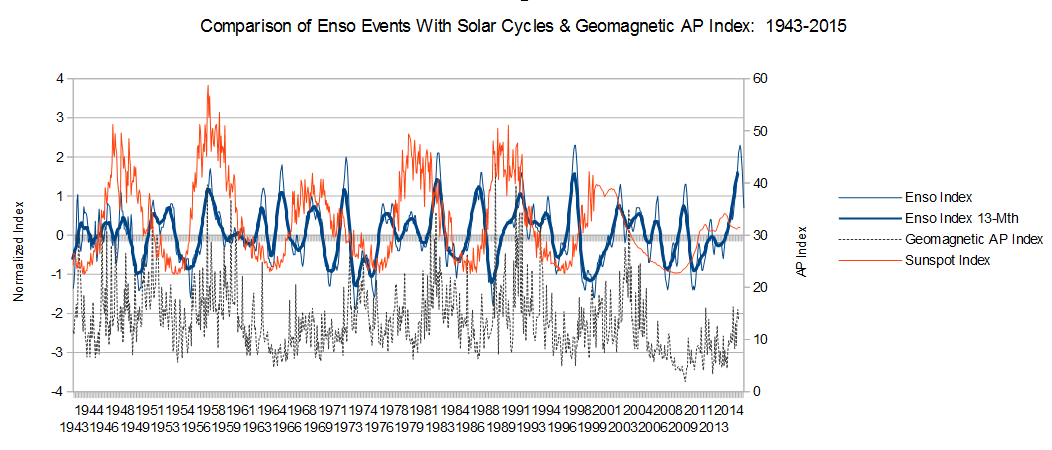 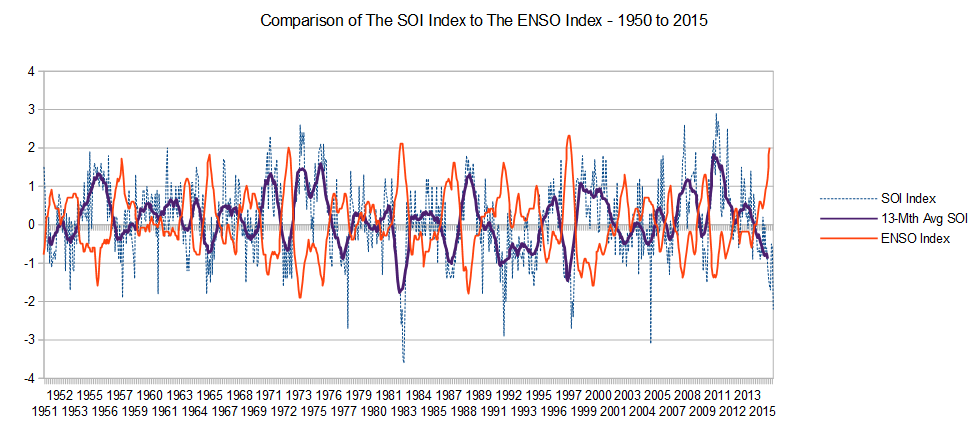  |
|
ant42
Level 3 Rank
 Melbourne, Australia
Posts: 129
|
Post by ant42 on Feb 10, 2019 10:31:03 GMT
Time will tell, I still think it will cool off, as it did in the cold AMO last cycle.
|
|
|
|
Post by nautonnier on Feb 10, 2019 14:57:51 GMT
l have bought a new coat !
|
|
|
|
Post by missouriboy on Feb 10, 2019 15:23:16 GMT
Time will tell, I still think it will cool off, as it did in the cold AMO last cycle. Should be interesting. 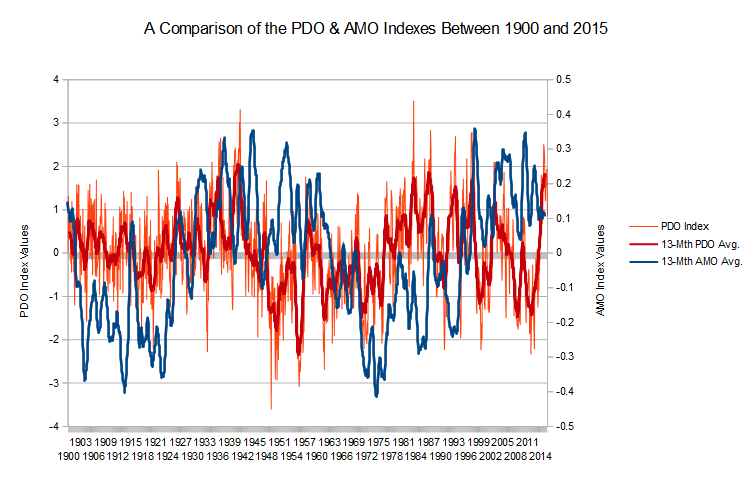 |
|
|
|
Post by sigurdur on Feb 10, 2019 15:43:27 GMT
Which indix is more important? PDO or AMO?
I have not done much research on the AMO. May have to do that.
|
|
|
|
Post by nautonnier on Feb 10, 2019 16:05:47 GMT
Which indix is more important? PDO or AMO? I have not done much research on the AMO. May have to do that. Hi Sig, The AMO seems to have a wider effect (or be correlated with wider effects) than you would think by comparing the size of the PDO and the AMO. The AMO and PDO phases change the impact of each other's effects too.  and this seems to suggest that the multi-decadal 'oscillation' is perhaps the wrong term as it is not a simple so many years at a time oscillation on a sine wave - it seems to be driven by some external 'forcing' perhaps LOD chasing the barycenter?
" Sea surface temperatures (SSTs) in the North Atlantic Ocean show multidecadal fluctuations known as the Atlantic Multidecadal Oscillation (AMO) . The AMO has been related to the thermohaline circulation, which implies a strong association to large-scale climate variability. Indeed, the variability of a wide range of climate parameters in the North Atlantic region has been related to the AMO, e.g. temperatures, precipitation, drought and hurricanes. Moreover, the AMO seems to influence the Asian summer monsoon, and South American precipitation. Most of these relationships have been established analyzing the short observational records or from experiments with climate models. In order to establish the stability of the multidecadal oscillation in the AMO as well as the association with climate, it is necessary to extend the record further back in time. Using tree-ring data from the Northern Hemisphere a reconstruction of the AMO, spanning AD 800 to 2000 is presented. The reconstruction suggests anomalously warm North Atlantic SSTs from ca. AD 900 to 1050, coinciding with the "Medieval Warm Period", as well as a phase between 1100 and 1400 with relatively little interdecadal variability. There is a prolonged negative phase of AMO from ca. 1600-1860, i.e. during the "Little Ice Age" (LIA). The multidecadal variability of approximately 40-80 years remains constant throughout the record, except around ca 1500-1700, i.e. during the LIA, when it breaks down." www.researchgate.net/publication/252952537_A_reconstruction_of_the_Atlantic_Multidecadal_Oscillation_AMO_for_the_last_1200_years |
|
|
|
Post by missouriboy on Feb 10, 2019 16:45:28 GMT
Which indix is more important? PDO or AMO? I have not done much research on the AMO. May have to do that. Hi Sig, The AMO seems to have a wider effect (or be correlated with wider effects) than you would think by comparing the size of the PDO and the AMO. The AMO and PDO phases change the impact of each other's effects too. and this seems to suggest that the multi-decadal 'oscillation' is perhaps the wrong term as it is not a simple so many years at a time oscillation on a sine wave - it seems to be driven by some external 'forcing' perhaps LOD chasing the barycenter?
" Sea surface temperatures (SSTs) in the North Atlantic Ocean show multidecadal fluctuations known as the Atlantic Multidecadal Oscillation (AMO) . The AMO has been related to the thermohaline circulation, which implies a strong association to large-scale climate variability. Indeed, the variability of a wide range of climate parameters in the North Atlantic region has been related to the AMO, e.g. temperatures, precipitation, drought and hurricanes. Moreover, the AMO seems to influence the Asian summer monsoon, and South American precipitation. Most of these relationships have been established analyzing the short observational records or from experiments with climate models. In order to establish the stability of the multidecadal oscillation in the AMO as well as the association with climate, it is necessary to extend the record further back in time. Using tree-ring data from the Northern Hemisphere a reconstruction of the AMO, spanning AD 800 to 2000 is presented. The reconstruction suggests anomalously warm North Atlantic SSTs from ca. AD 900 to 1050, coinciding with the "Medieval Warm Period", as well as a phase between 1100 and 1400 with relatively little interdecadal variability. There is a prolonged negative phase of AMO from ca. 1600-1860, i.e. during the "Little Ice Age" (LIA). The multidecadal variability of approximately 40-80 years remains constant throughout the record, except around ca 1500-1700, i.e. during the LIA, when it breaks down." www.researchgate.net/publication/252952537_A_reconstruction_of_the_Atlantic_Multidecadal_Oscillation_AMO_for_the_last_1200_yearsOne would think that they both influence weather and "climate" in middle N America. However, the HADSST3 time series for the Atlantic at 40-65 N seems to fit the American Grain Belt temperatures better than the HADSST3 time series for the NE Pacific from 20-65 N. Not sure I have much faith in the Pacific HADSST3 values prior to WWII. Chart 3 shows World ocean Hot spots at 200-700 m from ARGO. Could be that the AMO is more effective in mid-continent N America due to the "push" of warm Caribbean air masses up the 100th meridian then eastward. A decline in the strength of the gyre as proposed during low solar periods may account for the "sync" between the two. "Something", perhaps the Pacific may account(?) for the dramatic rise in temperatures from 1976, aka the Great Climate Shift, although the Pacific inflection point according to the graph still lags the 1976 startup. The Pacific and Atlantic seem to have been more in sync on the descending flank starting about 1950. But the science is settled, so I don't know why I bother with this.  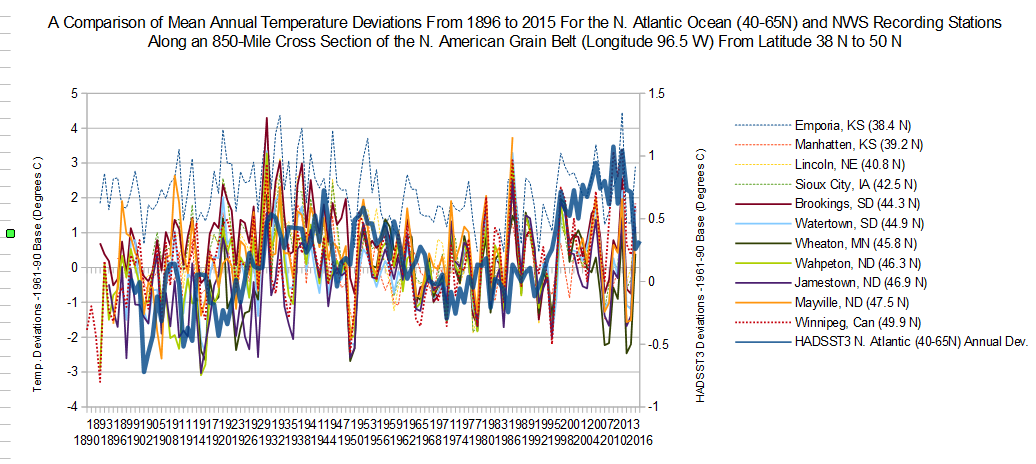 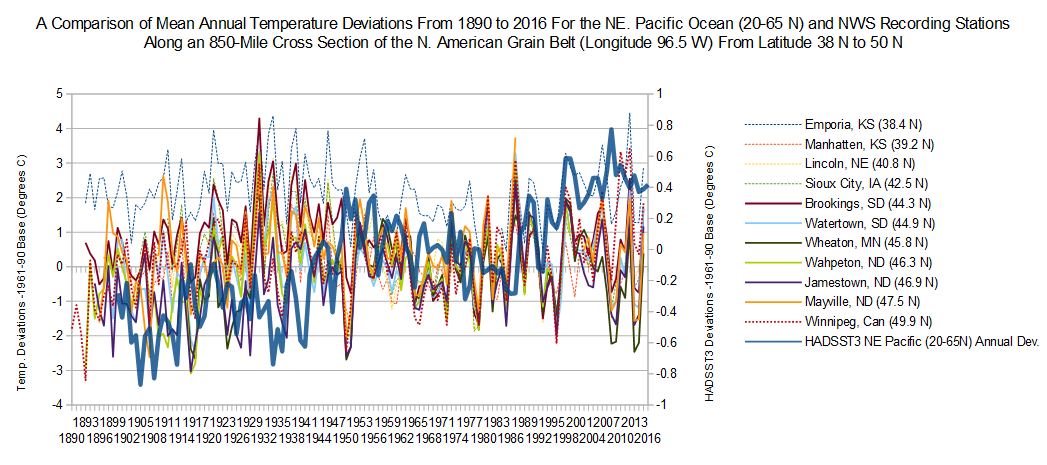 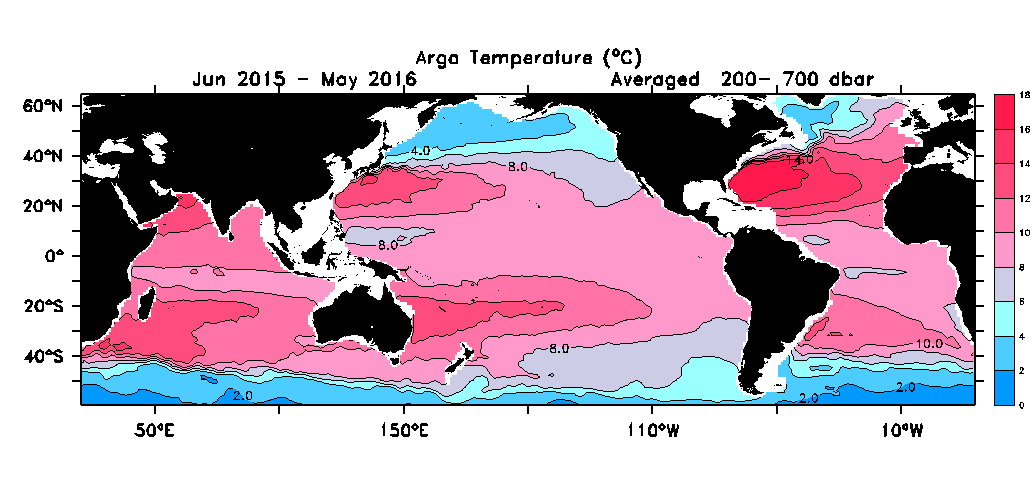 |
|
|
|
Post by missouriboy on Feb 10, 2019 20:46:04 GMT
Just took at look at Earth Null and seems to be plenty of cold water all over the globe, I was surprised at the volume around Africa, especially East Africa. That tropical West Pacific Warm Pool is not looking very warm. |
|
ant42
Level 3 Rank
Melbourne, Australia
Posts: 129
|
Post by ant42 on Feb 10, 2019 21:05:35 GMT
There is a lot of cooling going on at the moment, it looks like the same thing that happened in 2007 will happen again, a largely El Nino base state for 6 or 7 years will come to end with a series of La Nina.  What is also interesting is that it is roughly 12 years ago which fits well with the solar cycle variation. There was another great illustration a few pages back back of the North Atlantic, that was the most telling graph IMO. It showed a cooling down of the area at 59 North that was consistent right across the data series. We could all be wrong, but its hard to see how we don't go into a much cooler period for the next few decades, with the oceans running out of heat. |
|
|
|
Post by duwayne on Feb 11, 2019 16:08:16 GMT
Does anyone here know if the MVENSO values are detrended to eliminate the effect of the overall SST increase?
|
|
|
|
Post by missouriboy on Feb 12, 2019 4:33:10 GMT
Does anyone here know if the MVENSO values are detrended to eliminate the effect of the overall SST increase? If you are referring to MEI ENSO, I haven't seen any statements that it is detrended. However, the process of integrating the principal components could include a normalization process, which may effectively do the same thing. The multivariate ENSO index, abbreviated as MEI, is a method used to characterize the intensity of an El Niño Southern Oscillation (ENSO) event. Given that ENSO arises from a complex interaction of a variety of climate systems, MEI is regarded as the most comprehensive index for monitoring ENSO since it combines analysis of multiple meteorological and oceanographic components.[1]
MEI is determined as the first principal component of six different parameters: sea level pressure, zonal and meridional components of the surface wind, sea surface temperature, surface air temperature and cloudiness using data from the International Comprehensive Ocean-Atmosphere Data Set (ICOADS ).[2] MEI is calculated twelve times per year for each “sliding bi-monthly season”, characterized as January–February, February–March, March–April, and so on.[2] Large positive MEI values indicate the occurrence of El Niño conditions, while large negative MEI values indicate the occurrence of La Niña conditions.[2] |
|
|
|
Post by duwayne on Feb 12, 2019 16:27:21 GMT
Thanks, Missouriboy. Here’s why I ask. The HadcrutSST anomalies (sea surface temperatures) were around 0.0C in the early 1980’s. Currently the anomaly is around 0.5C. If that difference of 0.5C occurred in the ENSO area of the ocean, it could turn the area from neutral to El Nino without any of the local effects which are typically attributed to El Nino conditions.
The AMO is detrended so the overall ocean warming effect is removed and the result is just the oscillation effect around the normalized ocean temperature. I don’t know about ENSO.
It would seem logical that ENSO is detrended but I haven’t seen anything yet in my limited looks which confirms it is.
|
|
|
|
Post by Ratty on Feb 12, 2019 20:53:48 GMT
Thanks, Missouriboy. Here’s why I ask. The HadcrutSST anomalies (sea surface temperatures) were around 0.0C in the early 1980’s. Currently the anomaly is around 0.5C. If that difference of 0.5C occurred in the ENSO area of the ocean, it could turn the area from neutral to El Nino without any of the local effects which are typically attributed to El Nino conditions. The AMO is detrended so the overall ocean warming effect is removed and the result is just the oscillation effect around the normalized ocean temperature. I don’t know about ENSO. It would seem logical that ENSO is detrended but I haven’t seen anything yet in my limited looks which confirms it is. I have limited looks but I don't advertise the fact.  |
|
|
|
Post by icefisher on Feb 13, 2019 0:27:53 GMT
Thanks, Missouriboy. Here’s why I ask. The HadcrutSST anomalies (sea surface temperatures) were around 0.0C in the early 1980’s. Currently the anomaly is around 0.5C. If that difference of 0.5C occurred in the ENSO area of the ocean, it could turn the area from neutral to El Nino without any of the local effects which are typically attributed to El Nino conditions. The AMO is detrended so the overall ocean warming effect is removed and the result is just the oscillation effect around the normalized ocean temperature. I don’t know about ENSO. It would seem logical that ENSO is detrended but I haven’t seen anything yet in my limited looks which confirms it is. ENSO index is an anomaly based upon a "centered" 30 year base period updated every 5 years. The base period of the current ENSO is estimated based upon the past 30 years so over the next approximate 15 years its subject to some change. This can cause el ninos and la ninas to disappear or appear over time when the record is close. So for example if the current neutral conditions don't result in an official el nino, some time in the future if cooling sets in as predicted by Astromet an El nino could emerge after the fact. I am sure Astromet would have some nice things to say about that. Living with limited looks here also. |
|
|
|
Post by missouriboy on Feb 21, 2019 15:20:21 GMT
Thanks, Missouriboy. Here’s why I ask. The HadcrutSST anomalies (sea surface temperatures) were around 0.0C in the early 1980’s. Currently the anomaly is around 0.5C. If that difference of 0.5C occurred in the ENSO area of the ocean, it could turn the area from neutral to El Nino without any of the local effects which are typically attributed to El Nino conditions. The AMO is detrended so the overall ocean warming effect is removed and the result is just the oscillation effect around the normalized ocean temperature. I don’t know about ENSO. It would seem logical that ENSO is detrended but I haven’t seen anything yet in my limited looks which confirms it is. ENSO index is an anomaly based upon a "centered" 30 year base period updated every 5 years. The base period of the current ENSO is estimated based upon the past 30 years so over the next approximate 15 years its subject to some change. This can cause el ninos and la ninas to disappear or appear over time when the record is close. So for example if the current neutral conditions don't result in an official el nino, some time in the future if cooling sets in as predicted by Astromet an El nino could emerge after the fact. I am sure Astromet would have some nice things to say about that. Living with limited looks here also. Duwayne. I was scanning the MEI pages and found this. Thought you might be interested. El Niño/Southern Oscillation (ENSO) is the most important coupled ocean-atmosphere phenomenon to cause global climate variability on interannual time scales. Here we attempt to create a reliable ENSO index for much of the historical record by basing the extended Multivariate ENSO Index (MEI.ext) on the two main observed variables over the tropical Pacific that have been reconstructed by the Hadley Centre back to 1871. These two variables are: sea-level pressure (P; details in Allan and Ansell, 2006), and sea surface temperature (S; details in Rayner et al., 2006). Similar to the original MEI, the extended MEI.ext is computed separately for each of twelve sliding bi-monthly seasons (Dec/Jan, Jan/Feb,..., Nov/Dec). Since the original Hadley Centre data are already pre-filtered, the MEI.ext is calculated directly from the gridded fields as the first unrotated Principal Component (PC) of both P and S. This is accomplished by normalizing the total variance of each field first, and then performing the extraction of the first PC on the co-variance matrix of the combined fields (Wolter and Timlin, 2011). The figure above is taken from this paper and shows the bimonthly values of the MEI.ext, standardized with respect to each season, and to the 1871-2005 reference period. Caution should be exercised when interpreting the MEI.ext on a month-to-month basis, since it was developed mainly for research purposes, similar to the original MEI. Negative values of the MEI.ext represent the cold ENSO phase, a.k.a. La Niña, while positive MEI.ext values represent the warm ENSO phase (El Niño). www.esrl.noaa.gov/psd/enso/mei/ |
|


