|
|
Post by icefisher on Apr 30, 2010 15:37:47 GMT
On the other hand, if you know what types of weather produce what types of clouds, a perfect physical formulation of every cloud may not be necessary, and you resort to parametrizations. Thats correct then you test your parameterizations until you know you have them right. Thats a no brainer but it doesn't go further down the road to explaining what is meant by "current understanding of physics" so please take your thread hijack someplace else. Unless what you are saying is that "current understanding of physics" is whatever the um 33 or so GCM developers say it is. |
|
|
|
Post by magellan on Apr 30, 2010 16:26:44 GMT
I still do not understand that if the models all use immutable laws of physics that they (1) get different results and (2) fail to forecast (or whatever euphemism is currently in vogue for forecast) correctly the actions of the climate or weather. See my previous to last post. There is wriggle room in many of the variables in models. This is why different models end up with different results. Parameterizations are not based on assumptions - they are based on observational data. As realclimate explains: "We are still a long way from being able to simulate the climate with a true first principles calculation. While many basic aspects of physics can be included (conservation of mass, energy etc.), many need to be approximated for reasons of efficiency or resolutions (i.e. the equations of motion need estimates of sub-gridscale turbulent effects, radiative transfer codes approximate the line-by-line calculations using band averaging), and still others are only known empirically (the formula for how fast clouds turn to rain for instance). With these approximations and empirical formulae, there is often a tunable parameter or two that can be varied in order to improve the match to whatever observations exist. Adjusting these values is described as tuning and falls into two categories. First, there is the tuning in a single formula in order for that formula to best match the observed values of that specific relationship. This happens most frequently when new parameterisations are being developed.
Secondly, there are tuning parameters that control aspects of the emergent system. Gravity wave drag parameters are not very constrained by data, and so are often tuned to improve the climatology of stratospheric zonal winds. The threshold relative humidity for making clouds is tuned often to get the most realistic cloud cover and global albedo. Surprisingly, there are very few of these (maybe a half dozen) that are used in adjusting the models to match the data. It is important to note that these exercises are done with the mean climate (including the seasonal cycle and some internal variability) – and once set they are kept fixed for any perturbation experiment."www.realclimate.org/index.php/archives/2008/11/faq-on-climate-models/langswitch_lang/bg/used car salesmen..... Not one mention of uncertainties or what exactly is parametrized or how much. Clouds are absolutely 100% certainly assumed to behave in a manner to support the models. It is not based on "current understanding of physics". Let's duel ok? socold, have you ever done background research outside of realclimate? It's highly doubtful. |
|
|
|
Post by nautonnier on May 1, 2010 0:35:10 GMT
I still do not understand that if the models all use immutable laws of physics that they (1) get different results and (2) fail to forecast (or whatever euphemism is currently in vogue for forecast) correctly the actions of the climate or weather. See my previous to last post. There is wriggle room in many of the variables in models. This is why different models end up with different results. Parameterizations are not based on assumptions - they are based on observational data. As realclimate explains: "We are still a long way from being able to simulate the climate with a true first principles calculation. While many basic aspects of physics can be included (conservation of mass, energy etc.), many need to be approximated for reasons of efficiency or resolutions (i.e. the equations of motion need estimates of sub-gridscale turbulent effects, radiative transfer codes approximate the line-by-line calculations using band averaging), and still others are only known empirically (the formula for how fast clouds turn to rain for instance). With these approximations and empirical formulae, there is often a tunable parameter or two that can be varied in order to improve the match to whatever observations exist. Adjusting these values is described as tuning and falls into two categories. First, there is the tuning in a single formula in order for that formula to best match the observed values of that specific relationship. This happens most frequently when new parameterisations are being developed.
Secondly, there are tuning parameters that control aspects of the emergent system. Gravity wave drag parameters are not very constrained by data, and so are often tuned to improve the climatology of stratospheric zonal winds. The threshold relative humidity for making clouds is tuned often to get the most realistic cloud cover and global albedo. Surprisingly, there are very few of these (maybe a half dozen) that are used in adjusting the models to match the data. It is important to note that these exercises are done with the mean climate (including the seasonal cycle and some internal variability) – and once set they are kept fixed for any perturbation experiment."www.realclimate.org/index.php/archives/2008/11/faq-on-climate-models/langswitch_lang/bg/SoCold - I suggest you read about Edward Lorenz and his discovery of the chaotic behavior of weather models. In his case all he did was reduce floating point to fixed point variables for a restart and the models were wildly different in their output. In the cases you are quoting you have 'wiggle room' <sigh> In a chaotic model that means that you have NO justification to believe any output. In mesoscale weather models it is very difficult to retain accuracy for more than an HOUR even with accurate starting values for all variables. I would say that the reason for similarity in the GCM output is more an artifact of common assumptions and design rather than any reliability in output. |
|
|
|
Post by sigurdur on May 1, 2010 1:43:10 GMT
In the cases you are quoting you have 'wiggle room' <sigh> In a chaotic model that means that you have NO justification to believe any output.
In mesoscale weather models it is very difficult to retain accuracy for more than an HOUR even with accurate starting values for all variables.
I would say that the reason for similarity in the GCM output is more an artifact of common assumptions and design rather than any reliability in output.[/quote]
You have hit the nail on the head with your last sentence.
|
|
|
|
Post by icefisher on May 1, 2010 2:36:31 GMT
I would say that the reason for similarity in the GCM output is more an artifact of common assumptions and design rather than any reliability in output. You have hit the nail on the head with your last sentence.[/quote] I would say so considering all the models went one way and the climate went another. Every day that is going by it is getting to be a more solid truth. We have warmers in here getting excited over an El Nino 3/4's the size of 98 anomaly wise when what they need is a double sized one. By the time the projected La Nina comes and goes they probably will need a triple sized one assuming it doesn't amount to a lot of cooling. . . .and its real possible this trend is going to go on for another 25 years well before which time the El Nino they would need could only be brought by the tooth fairy. |
|
|
|
Post by socold on May 3, 2010 0:38:25 GMT
Climate models exhibit such behavior. For example here's several runs of the same model using the same forcing scenaro, but slightly different initial states: 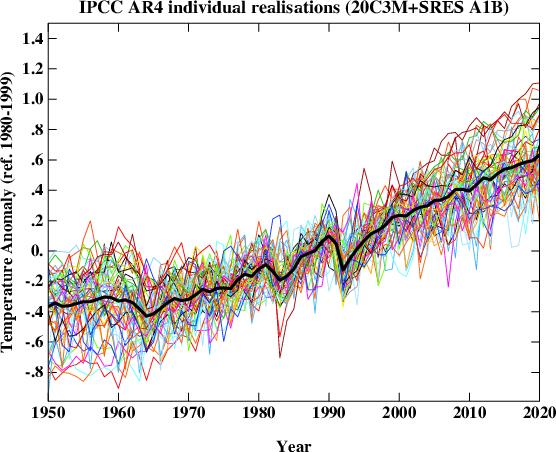 The noise is chaotic. Notice though that the overall trend (ie climate) is very predictable. No matter which point is chosen in the wiggle room the output comes out around the range of 2.5 and 4.5C warming per doubling of co2. Evidentially then that property of the model is not subject to chaos. I think you have it the wrong way round. Think about it, if the recent ENSO was stronger than the 98 one and we still didn't reach 1998 temperatures.... |
|
|
|
Post by nautonnier on May 3, 2010 1:41:25 GMT
And as I said in my post - the part that you didn't reference: "I would say that the reason for similarity in the GCM output is more an artifact of common assumptions and design rather than any reliability in output."For example all those AR4 models will have the hydrologic cycle and clouds as a positive feedback and a highly sensitive system. This is their (and your) basic assumption. Well even NCAR and the Climate Process Team on Low-Latitude Cloud Feedbacks on Climate Sensitivity (cloud CPT) does not agree with that now. " The world’s first superparameterization climate sensitivity results show strong negative cloud
feedbacks driven by enhancement of boundary layer clouds in a warmer climate"Read www.usclivar.org/Newsletter/VariationsV4N1/BrethertonCPT.pdfI suggest that you get your research reading up to date SoCold. The new research coming out of NCAR, GFDL and NASA would appear to negate (pun intended) the warming claimed in the AR4 modeling. |
|
|
|
Post by hairball on May 3, 2010 2:39:37 GMT
I guess you're expecting another El Nino or two socold. Maybe one of the models' forcings is dialled up too high.  |
|
|
|
Post by socold on May 3, 2010 4:21:37 GMT
And as I said in my post - the part that you didn't reference: "I would say that the reason for similarity in the GCM output is more an artifact of common assumptions and design rather than any reliability in output."For example all those AR4 models will have the hydrologic cycle and clouds as a positive feedback and a highly sensitive system. This is their (and your) basic assumption. The sensitivity of the system cannot be explicitly set, it emerges from all the interacting parts. For parts that can be set the settings cannot be simply plucked out of thin air, they must be justified with regards to atmospheric observations. Someone is of course free to use different settings as long as those setting can be justified as being realistic. There is no date on the document but it doesn't look new. There is nothing referenced after 2006. But it is certainly interesting, I will explore it further. This is precisely how models could be used to demonstrate low climate sensitivity (they report climate sensitivity of 1.5C per doubling which I think can be regarded as low for the sake of this discussion). |
|
|
|
Post by socold on May 3, 2010 4:23:58 GMT
I guess you're expecting another El Nino or two socold. Maybe one of the models' forcings is dialled up too high. I think we are shortly due a step jump in temperature as the solar cycle reaches maximum. Something like the step jump from the 90s to the 00s for example. |
|
|
|
Post by icefisher on May 3, 2010 6:33:11 GMT
The sensitivity of the system cannot be explicitly set, it emerges from all the interacting parts. For parts that can be set the settings cannot be simply plucked out of thin air, they must be justified with regards to atmospheric observations. Someone is of course free to use different settings as long as those setting can be justified as being realistic.
You aren't narrowing it down much Socold when you consider that selecting a single tree on the Yamal Peninsula, NAS pooh poohed stripbarked bristlecone pines and upside down varves are considered by modeling teams as being reasonable choices for determining what the climate was a century ago. |
|
|
|
Post by icefisher on May 3, 2010 7:13:50 GMT
I guess you're expecting another El Nino or two socold. Maybe one of the models' forcings is dialled up too high. I think we are shortly due a step jump in temperature as the solar cycle reaches maximum. Something like the step jump from the 90s to the 00s for example. Indeed your theory is due for something. But if you actually plot what you suggest above (1995-2005) all you get is about a .0133 per annum slope estimating out to 2018 less than half of what you need to keep your position viable. You see Socold step jumps weren't predicted. What was predicted was the continued warming that disappeared shaping the step jump and decreasing the slope by 50%+. And post 2005 the slope is still declining down each year now to a .0108/annum as of 2009. If you double the step jump above all you get is a .0241/annum slope so your theory still comes up far short. If you triple the step jump then and only then do you achieve your prediction with your prediction at .030/annum and the step jump projection at .0349/annum. And that analysis does not include the 2006-2009 portion of the step. If you put that in as part of the step function then you need more than a tripling of the step to achieve your prediction. It really is sad that you defend your position so adamantly and you have no clue whatsoever what it takes to keep it alive. What it needs is a staircase with all risers and no treads. You say one stray model predicted a 15 year step. Most likely from an unprecedented volcanic eruption assuredly it wasn't a chaotic event as recognizing chaotic theory in the climate brings the whole body of current modeling theory down. At any rate that model must have assumed it to be a one time event. . . .and the damned volcano hasn't erupted yet. If you get more steps all the work of the IPCC estimating economic harm from 3 deg C of warming in the next century is all wasted. Thus steps are not what you need. Remember, Socold, the universal truth: God always intervenes against the imposters. |
|
|
|
Post by socold on May 3, 2010 20:33:46 GMT
I think we are shortly due a step jump in temperature as the solar cycle reaches maximum. Something like the step jump from the 90s to the 00s for example. Indeed your theory is due for something. But if you actually plot what you suggest above (1995-2005) all you get is about a .0133 per annum slope estimating out to 2018 less than half of what you need to keep your position viable. I expect it will happen faster than 10 years. I think it should occur within a few years. The key prediction of ever rising greenhouse gas levels is that global temperature will rise over decades. How that rise occurs is rather more part of the details. Whether it rises gradually over any particular 5 year period, or instead goes flat followed by a step change is a matter of details of how climate warms up in response to an energy imbalance. If you look close at the individual model runs I posted, no individual run shows continued warming year to year. There are indeed steps, and in fact this is how the temperature record also appears. My reasoning is reflected in the following graphic. 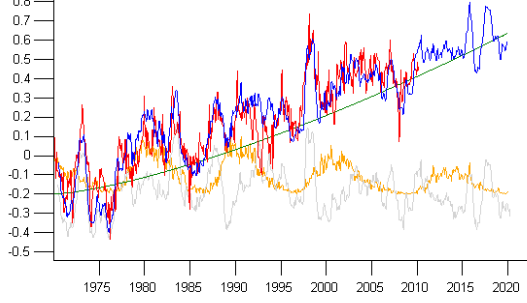 The left hand scale is temperature anomaly in degrees C. The light grey line depicts contribution to global temperature from ENSO variability. The orange line depicts contribution to global temperature from the 11 year solar cycle. The green line is a rising background warming trend. The blue line is the sum of the three. You have probably noticed the x-axis goes into the future, up to 2020. How did I add the future data? For the green line that is self-explaintory. For the light grey ENSO line I took a previous pattern of ENSO. For the orange solar line I simply made a solar-like cycle. I've been very conservative and made my imaginary cycle 24 about half the magnitude of cycle 23. The red line is HadCRUT3. The blue line tracks HadCRUT3 very well, including the a flattening of temperatures since 2003. This is depite the blue line including a background warming trend (the green line) over this period. The cause of this flatness is the ENSO variation which has a negative trend since 2003 and the solar cycle decline which has also been negative. As you can see according to this now that the solar cycle is again increasing, an imminent step change is expected in global temperature. As far as I am aware no future volcanic eruptions are included in the model scenarios. |
|
|
|
Post by icefisher on May 3, 2010 21:26:15 GMT
Indeed your theory is due for something. But if you actually plot what you suggest above (1995-2005) all you get is about a .0133 per annum slope estimating out to 2018 less than half of what you need to keep your position viable.
The key prediction of ever rising greenhouse gas levels is that global temperature will rise over decades. How that rise occurs is rather more part of the details. Whether it rises gradually over any particular 5 year period, or instead goes flat followed by a step change is a matter of details of how climate warms up in response to an energy imbalance.
If so then in another 10 or 20 years after that (2030 or 2040) and rereview the results, if you don't get the step change by 2020 then you should consider maybe revising them down down down down yet another 50%.
If you look close at the individual model runs I posted, no individual run shows continued warming year to year. There are indeed steps, and in fact this is how the temperature record also appears.
Go take your models to a reputable national CPA firm of your choice work up a proforma for some green industry for providing to potential investors and see if you can pay them to sign off on it. Then get back to me with the results.
My reasoning is reflected in the following graphic. The left hand scale is temperature anomaly in degrees C. The light grey line depicts contribution to global temperature from ENSO variability. The orange line depicts contribution to global temperature from the 11 year solar cycle. The green line is a rising background warming trend.As far as I am aware no future volcanic eruptions are included in the model scenarios.
|
|
|
|
Post by socold on May 4, 2010 0:01:02 GMT
I set 1995-2005 step to begin with this year 2010, not in a few years or 10 years. Just so we are on the same page. Such a change would result in a .13degC/decade skill prediction result for the AR4 models, still far short of what they predicted. Move it out a few years or 10 years it gets much worse. The step change I proposed is compatible with continuation of the existing background warming trend that has occured over the past 30 years, which might be an exponential curve so the rate may speed up. I've never pointed at a decade of warming. I don't do decades. Models in the 80s predicted warming in coming decades. That needn't have been so. The real world temperature could have peaked in the 80s and gone flat, or even declined since then. I would love to include the first half the 20th century and even the 19th century if possible, but the further back, the less reliable the data. Since 1970 I am confident in the ENSO, global temperature and TSI data are accurate enough to compare. Still I did something a while back, but with sunspot counts instead of TSI and using greenhouse gas and aerosol forcings: 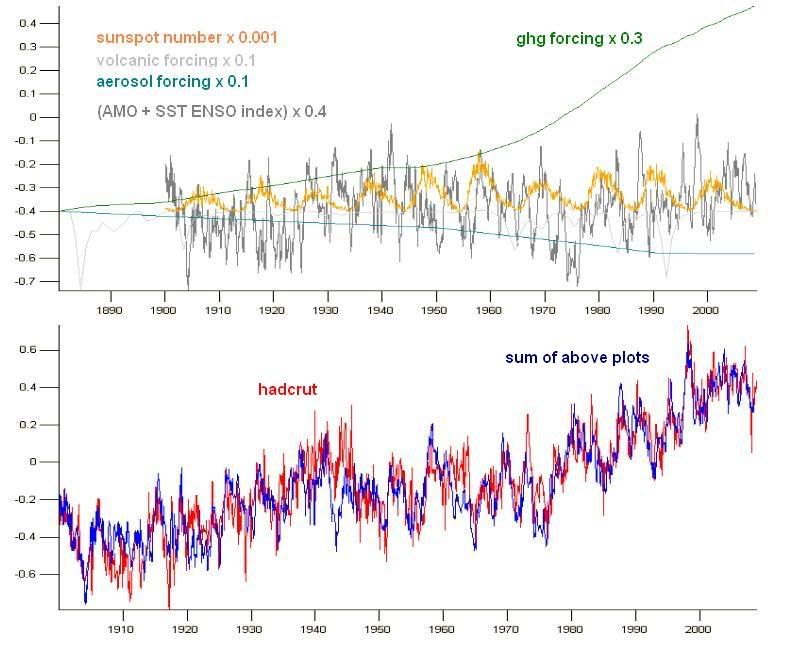 However the early 20th century is irrelevant to my original point and the original image. I didn't attribute the green background warming line. I haven't said the green exponential rise is co2. I've just said, look what happens if I overlay solar and ENSO variation on this rising green trend. Lo and behold it fits the hadcrut3 global temperature data. This suggests two things. First that variation in global surface temperature is almost entirely explained by ENSO and the solar cycle. Second that recent changes in global surface temperature (eg since 1998, since 2003, since 2005, since "insert year here") is consistent with an exponential background warming trend. As a result there is no reason to expect global warming has stopped and in fact every reason to expect it to continue. It'll be internal variation akin to ENSO. |
|


