|
|
Post by magellan on May 4, 2010 1:53:23 GMT
I set 1995-2005 step to begin with this year 2010, not in a few years or 10 years. Just so we are on the same page. Such a change would result in a .13degC/decade skill prediction result for the AR4 models, still far short of what they predicted. Move it out a few years or 10 years it gets much worse. The step change I proposed is compatible with continuation of the existing background warming trend that has occured over the past 30 years, which might be an exponential curve so the rate may speed up. I've never pointed at a decade of warming. I don't do decades. Models in the 80s predicted warming in coming decades. That needn't have been so. The real world temperature could have peaked in the 80s and gone flat, or even declined since then. I would love to include the first half the 20th century and even the 19th century if possible, but the further back, the less reliable the data. Since 1970 I am confident in the ENSO, global temperature and TSI data are accurate enough to compare. Still I did something a while back, but with sunspot counts instead of TSI and using greenhouse gas and aerosol forcings: 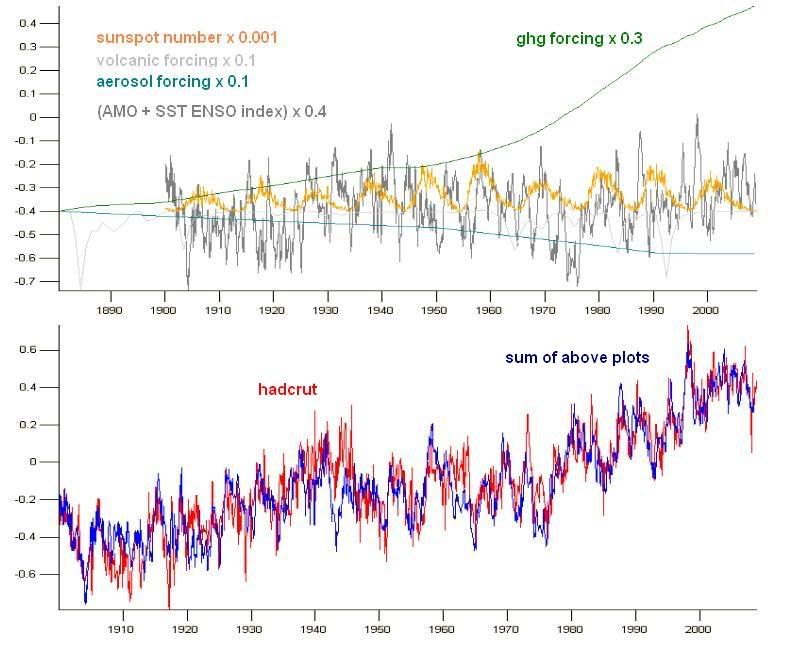 However the early 20th century is irrelevant to my original point and the original image. I didn't attribute the green background warming line. I haven't said the green exponential rise is co2. I've just said, look what happens if I overlay solar and ENSO variation on this rising green trend. Lo and behold it fits the hadcrut3 global temperature data. This suggests two things. First that variation in global surface temperature is almost entirely explained by ENSO and the solar cycle. Second that recent changes in global surface temperature (eg since 1998, since 2003, since 2005, since "insert year here") is consistent with an exponential background warming trend. As a result there is no reason to expect global warming has stopped and in fact every reason to expect it to continue. It'll be internal variation akin to ENSO. You still have not answered the question. Do climate models model clouds correctly? YES OR NO? Are you capable of answering simple questions? |
|
|
|
Post by magellan on May 4, 2010 2:20:52 GMT
And as I said in my post - the part that you didn't reference: "I would say that the reason for similarity in the GCM output is more an artifact of common assumptions and design rather than any reliability in output."For example all those AR4 models will have the hydrologic cycle and clouds as a positive feedback and a highly sensitive system. This is their (and your) basic assumption. The sensitivity of the system cannot be explicitly set, it emerges from all the interacting parts. For parts that can be set the settings cannot be simply plucked out of thin air, they must be justified with regards to atmospheric observations. Someone is of course free to use different settings as long as those setting can be justified as being realistic. There is no date on the document but it doesn't look new. There is nothing referenced after 2006. But it is certainly interesting, I will explore it further. This is precisely how models could be used to demonstrate low climate sensitivity (they report climate sensitivity of 1.5C per doubling which I think can be regarded as low for the sake of this discussion). There is no date on the document but it doesn't look new. There is nothing referenced after 2006. But it is certainly interesting, I will explore it further. New? Do you also need a definition of what a prediction is? Model outputs from TAR are predictions. Models created to match the past are not predictions. Is it that difficult to understand? This is why I generally ignore these types of discussions as 99% of what you post is arm waiving. If you would, address the issues from this thread: solarcycle24com.proboards.com/index.cgi?action=display&board=globalwarming&thread=1156&page=10#45943This is physics as we currently understand it These are the predictions by models and the resulting observations. What part this is too difficult to grasp? Take your pick, none support the model predictions. None.   Start living in reality and maybe more will not be so critical of what you post. |
|
|
|
Post by scpg02 on May 4, 2010 2:45:32 GMT
Start living in reality and maybe more will not be so critical of what you post. Wishful thinking there. I'd like to know who is paying him. |
|
|
|
Post by hairball on May 4, 2010 3:37:38 GMT
My reasoning is reflected in the following graphic. 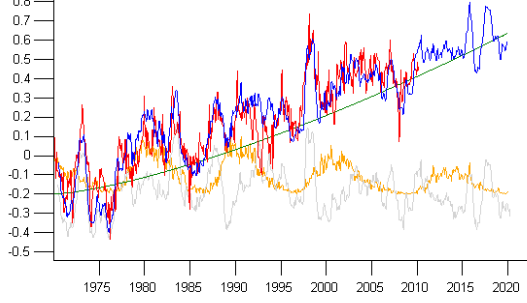 Great work socold; it almost keeps up with the models. How would it look with the 1940's ENSO pasted on the end instead of the 80's? In light of the positive feedbacks that have been broken in the last couple of months what will it look like in 2100? |
|
|
|
Post by icefisher on May 4, 2010 3:54:54 GMT
The step change I proposed is compatible with continuation of the existing background warming trend that has occured over the past 30 years, which might be an exponential curve so the rate may speed up. You said: I think we are shortly due a step jump in temperature as the solar cycle reaches maximum. Something like the step jump from the 90s to the 00s for example.
I said such a step change would be inadequate to avoid actual temperatures from diverging even further off the predicted track. You are grossly underestimating what you need to get back on track.
I would love to include the first half the 20th century and even the 19th century if possible, but the further back, the less reliable the data. Since 1970 I am confident in the ENSO, global temperature and TSI data are accurate enough to compare. Still I did something a while back, but with sunspot counts instead of TSI and using greenhouse gas and aerosol forcings: However the early 20th century is irrelevant to my original point and the original image. I didn't attribute the green background warming line. I haven't said the green exponential rise is co2. I've just said, look what happens if I overlay solar and ENSO variation on this rising green trend. Lo and behold it fits the hadcrut3 global temperature data.
This suggests two things. First that variation in global surface temperature is almost entirely explained by ENSO and the solar cycle. Second that recent changes in global surface temperature (eg since 1998, since 2003, since 2005, since "insert year here") is consistent with an exponential background warming trend. As a result there is no reason to expect global warming has stopped and in fact every reason to expect it to continue.
LOL! Socold you are truly amazing!It'll be internal variation akin to ENSO.
|
|
|
|
Post by steve on May 4, 2010 9:05:40 GMT
More subtle variations in the heat distribution around the earth (like ENSO) will affect incoming and outgoing radiation. So it is not necessarily that heat is "hiding" somewhere. Just that for a period less energy gets in or more gets out.
|
|
|
|
Post by icefisher on May 4, 2010 11:11:15 GMT
More subtle variations in the heat distribution around the earth (like ENSO) will affect incoming and outgoing radiation. So it is not necessarily that heat is "hiding" somewhere. Just that for a period less energy gets in or more gets out. Except the CERES satellite data suggests exactly the opposite. It shows less solar radiation being reflected, suggesting more energy is getting in and it shows less energy getting out. Maybe the hobbits of Middle Earth are emitting gobs of virtual photons that our instruments are not picking up. |
|
|
|
Post by icefisher on May 4, 2010 14:54:30 GMT
[ Nice graph! Must have taken some time. It does seem implausible though that all the ENSO activity and solar grand maximum activity is placed in the negative anomaly range. So what does a graph with proper scaling suggest as to what the normal values are for these measures and how does that effect your chart? |
|
|
|
Post by steve on May 4, 2010 15:03:29 GMT
More subtle variations in the heat distribution around the earth (like ENSO) will affect incoming and outgoing radiation. So it is not necessarily that heat is "hiding" somewhere. Just that for a period less energy gets in or more gets out. Except the CERES satellite data suggests exactly the opposite. It shows less solar radiation being reflected, suggesting more energy is getting in and it shows less energy getting out. Maybe the hobbits of Middle Earth are emitting gobs of virtual photons that our instruments are not picking up. You have to learn to understand the difference between a generic question and answer and a specific question and answer. Your original question was: That's a generic question and got a generic answer. The answer to the specific question you have now come up because you hate admitting that you asked a straightforward question that got a straightforward answer, is that either the CERES data is a bit wrong or one or other of the earth temperature/heat content datasets is wrong or the the heat is indeed "hiding" somewhere where no good measurements are being taken. The only other solution is that the principle of the conservation of energy is wrong. |
|
|
|
Post by icefisher on May 4, 2010 15:17:24 GMT
If there is confusion about what question you are answering Steve it might help if you quote the "right" question, rather than the "wrong" question. You must have gone on an extensive search for the question you didn't quote or it must have been sticking in your craw for a long time. The only other solution is that the principle of the conservation of energy is wrong. Hmmmmm, oh really how did you arrive at a conclusion like that? |
|
|
|
Post by sigurdur on May 5, 2010 0:30:49 GMT
If there is confusion about what question you are answering Steve it might help if you quote the "right" question, rather than the "wrong" question. You must have gone on an extensive search for the question you didn't quote or it must have been sticking in your craw for a long time. The only other solution is that the principle of the conservation of energy is wrong. Hmmmmm, oh really how did you arrive at a conclusion like that? Steve, You have hit it out of the park!!!!!!!!!! It isn't so much that the conservation of energy is wrong, it is that something is missing in the equation that we don't know about yet. |
|
|
|
Post by steve on May 5, 2010 7:29:05 GMT
If there is confusion about what question you are answering Steve it might help if you quote the "right" question, rather than the "wrong" question. You must have gone on an extensive search for the question you didn't quote or it must have been sticking in your craw for a long time. The only other solution is that the principle of the conservation of energy is wrong. Hmmmmm, oh really how did you arrive at a conclusion like that? It's another Icefisher debating tactic. I give 3 alternatives that I think cover "all the bases" (since Sigurdur started with the baseball metaphors. You pick one of them and imply that that is my conclusion. Sigurdur Which is why I said: The physical laws imply that there is indeed something missing or wrong in the equation. It's just bizarre for Icefisher to pick one dataset that shows evidence of current "global warming" to undermine all the other evidence that says global warming has never been and is not expected to be monotonic. |
|
|
|
Post by icefisher on May 5, 2010 12:12:22 GMT
If there is confusion about what question you are answering Steve it might help if you quote the "right" question, rather than the "wrong" question. You must have gone on an extensive search for the question you didn't quote or it must have been sticking in your craw for a long time. Hmmmmm, oh really how did you arrive at a conclusion like that? It's another Icefisher debating tactic. I give 3 alternatives that I think cover "all the bases" (since Sigurdur started with the baseball metaphors. You pick one of them and imply that that is my conclusion. Which is why I said: You are incorrect Steve. I did not pick one of three. I challenged what your evidence was for your conclusion: "The only other solution is that the principle of the conservation of energy is wrong."
You are stating that either the measurements of SW incoming or LW out are wrong or heat content datasets are wrong or the principle of the conservation of energy is wrong. That statement is suspect and previous beliefs about heat having to be somewhere was proven erroneous between 150 and 200 years ago. 200 years ago the theory of conservation of energy was formed and solidified by solving the problem you are posing above as a conundrum. Fact is that conundrum has already been falsified. If the measurements we take are not significantly wrong or incomplete the most likely alternative is heat is being converted to matter or another form of energy. If that is happening or our measurements are in error then the entire world of climate science as we currently understand it is in jeopardy (unless the error can be traced to some kind of explicit cause). But either way the falsification of the principle of energy conservation is the least likely alternative. We are not seeing little errors here, thus they cannot be passed off as insignificant instrument errors and then move on with our current beliefs and pretend our belief system was built on anything more substantial than our erroneous observations. . . .you can't salvage your theory by searching high and wide for a burlwood knot with the ideal tree ring spacing to get you out of this pickle either. We keep improving and improving our heat measurement capabilities if these are wrong the very foundation of warmist theory is built on slick sand. |
|
|
|
Post by hunter on May 5, 2010 12:42:52 GMT
|
|
|
|
Post by steve on May 5, 2010 14:46:36 GMT
Icefisher,
No you made a sarcastic comment that didn't clearly indicate that you might be desperate enough to suggest that that significant amounts of heat may be "being converted to matter or another form of energy"
Now while I think the suggestion is utterly ludicrous, it does fall within one of my alternatives that.
if you are happy for me to swap the word heat for energy.
Of course, not being a physicist you won't realise that converting heat to matter requires more work to be done and therefore more heat will be expended than will be converted. Unless of course you are happy to break the Second Law of Thermodynamics instead.
|
|


