|
|
Post by icefisher on May 13, 2010 15:41:52 GMT
|
|
|
|
Post by hunter on May 13, 2010 16:15:40 GMT
It is disturbing that so much is inferred from so little. And then one reviews the placement of the data collection site, and there is no way the site is not picking up air traffic and asphalt influences. |
|
|
|
Post by hairball on May 13, 2010 16:16:42 GMT
Good Lord. Someone want to explain to me why this is scientific incompetence rather than fraud?
|
|
|
|
Post by hunter on May 13, 2010 16:18:46 GMT
Good Lord. Someone want to explain to me why this is scientific incompetence rather than fraud? Corruption and incomeptence arein some ways twin siblings. |
|
|
|
Post by socold on May 13, 2010 22:17:41 GMT
A temperature sensor cannot get warmer and warmer indefinitely just because it's on asphalt. You'd certainly get a jump if you moved the sensor onto asphalt for the first time, but once that's done you wouldn't expect further jumps or the temperature to keep on rising.
|
|
|
|
Post by glc on May 13, 2010 22:25:24 GMT
A temperature sensor cannot get warmer and warmer indefinitely just because it's on asphalt. You'd certainly get a jump if you moved the sensor onto asphalt for the first time, but once that's done you wouldn't expect further jumps or the temperature to keep on rising. Exactly. UH can only induce a warming trend is if there is a trend in the UH. |
|
|
|
Post by icefisher on May 13, 2010 22:32:58 GMT
A temperature sensor cannot get warmer and warmer indefinitely just because it's on asphalt. You'd certainly get a jump if you moved the sensor onto asphalt for the first time, but once that's done you wouldn't expect further jumps or the temperature to keep on rising. You might try reading the article before replying Socold. You can see jumps in two locations: 1) when station was changed to the airport and 2) when they upgraded the airport runway) Additionally, it may not just be asphalt but ecotourism has been on the rise from folks looking to go see the arctic melt with it rising to nearly 140,000 visits a year. So yes there is a trend in the UH besides the two step adjustments with many more jets blowing hot gases near the sensors. Further the following graph shows the ground record is increasing at almost twice the rate the satellite record shows. Seems to be in 100% compliance with your observations Socold! You will have to do much much better Socold!  |
|
|
|
Post by glc on May 14, 2010 0:22:48 GMT
Additionally, it may not just be asphalt but ecotourism has been on the rise from folks looking to go see the arctic melt with it rising to nearly 140,000 visits a year. So yes there is a trend in the UH besides the two step adjustments with many more jets blowing hot gases near the sensors.
There doesn't look to be a trend in UH to me. Between 1983 and 1986 the orange (svalbard) and blue (MSU) line are pretty much together. Similarly between 1994 and 1998 they track each other closely and in the last couple of years they are within a whisker of eacjh other. There is no obvious long term divergence. The surface temperatures are more variable than the MSU temperatures (which seems reasonable) and it looks as though any disagreement in trends is due to a combination of the dip in the late 1980s and the spike in 2006.
For what it's worth, I think some of the 2006 data might be suspect.
|
|
|
|
Post by nautonnier on May 14, 2010 0:40:27 GMT
Additionally, it may not just be asphalt but ecotourism has been on the rise from folks looking to go see the arctic melt with it rising to nearly 140,000 visits a year. So yes there is a trend in the UH besides the two step adjustments with many more jets blowing hot gases near the sensors.There doesn't look to be a trend in UH to me. Between 1983 and 1986 the orange (svalbard) and blue (MSU) line are pretty much together. Similarly between 1994 and 1998 they track each other closely and in the last couple of years they are within a whisker of eacjh other. There is no obvious long term divergence. The surface temperatures are more variable than the MSU temperatures (which seems reasonable) and it looks as though any disagreement in trends is due to a combination of the dip in the late 1980s and the spike in 2006. For what it's worth, I think some of the 2006 data might be suspect. Then that same metric is used to infer the temperatures in a huge area - and the entire area has the jump in 'trend'. The effect of a concrete or tarmac surface is actually NOT a uniform increase. Long cold nights with little traffic may get cooler then show a rapid increase in temperatures as sun and traffic increase. But then who wants accurate metrics especially near the poles - certainly not glc or SoCold. |
|
|
|
Post by trbixler on May 14, 2010 13:16:47 GMT
I used to wonder why the north glowed red on all the anomaly maps, just add one thermometer and a dash of AHI and there you have the great science of CO2.
|
|
|
|
Post by glc on May 14, 2010 19:00:30 GMT
I used to wonder why the north glowed red on all the anomaly maps, just add one thermometer and a dash of AHI and there you have the great science of CO2. AHI (or UHI) has got nothing to do with the Svalbard trend. That's obvious by looking at the graph. |
|
|
|
Post by hairball on May 14, 2010 19:28:38 GMT
Aside from the graph GLC, is it professional to splice temperature records from three sites to produce the Svalbard temperature since 1912?
|
|
|
|
Post by socold on May 14, 2010 20:07:28 GMT
|
|
|
|
Post by hairball on May 14, 2010 20:18:30 GMT
0.8C per decade - all of it outside Summer and none of it hot enough to melt sea ice. 2006 for example: 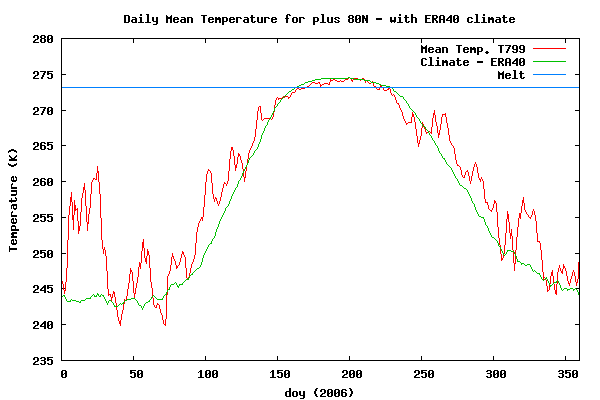 Why should this worry anyone? Is the IPCC correct to say that warming is accelerating? |
|
|
|
Post by socold on May 14, 2010 20:33:45 GMT
Actually the reason why the warming in summer is lower is because the energy is being expended melting the ice rather than raising temperature.
|
|


