|
|
Post by norpag on Jun 7, 2010 15:21:30 GMT
The original suggested "IPCC" version can be found at climatesense-norpag.blogspot.com/ I have modified the thread to simply post a possible 30 year forecast here directly below. Thirty Year Climate Forecast .The geologic record shows clearly that the sun is the main climate driver. The Milankovitch multi-millennial orbital cycles in NH insolation are firmly established in the record as are the Schwab and deVries cycles. Other millennial and decadal variations in solar activity are present in the record. TSI is not the only or even the best indicator of solar activity – variations in EUV radiation and the GCR flux (via cloud formation and earth’s albedo) seem to be more important on decadal and centennial scales . Earth’s climate is the result of complex resonances between all these solar cycles with the lunar declination cycles and endogenous earth processes. At this time the sun has entered a quiet phase with a dramatic drop in solar magnetic field strength since 2004. This suggests the probability of a cooling phase on earth and it seems possible that Cycle 23 is more or less equivalent to Cycle 4 so that a Dalton type minimum is likely. It is now clear that the patterns of the earth’s ocean and atmospheric current systems provide the most immediate guide to the current state of the climate when climate is considered as the result of the complex processes discussed above and these systems provide the best clues as to likely developments over the next 20 – 30 years. Beyond that time span predictions are currently of little practical value. The small effect of anthropogenic CO2 cannot be calculated with any useful accuracy until we can better quantify the effect of the natural variations. Of particular note is the negative phase of the PDO which began about ten years ago and may well last for another 20 years. This suggests that La Ninas will be more frequent than El Ninos during this time span. A general earth cooling is thus more likely as was the case from 1940 to 1970 when similar conditions prevailed. Concurrent changes in the Arctic Oscillation suggest a pattern of meridional atmospheric flow will be more common than the more latitudinal flows of warmer periods. Policymakers may wish to note the following possible effects on earth’s climate for the next 20 – 30 years. A cooler world with lower SSTs usually means a dryer world. Thus droughts will be more likely in for example east Africa with possible monsoon failures in India. In California the PDO will mean less rainfall with more forest fires in the south. However in the Cascades and Northern Sierras snowpack could increase since more of the rain could occur as snow. Northern Hemisphere growing seasons will be shorter with occasional early and late frosts and drought in the US corn belt and in Asia repeats of the harsh Mongolian and Chinese winters of 2009 – 10 . In Europe cold snowy winters and cool cloudy summers will be more frequent . There will be a steeper temperature gradient from the tropics to the poles so that violent thunderstorms with associated flooding and tornadoes will be more frequent in the USA, At the same time the jet stream will swing more sharply North – South thus local weather in the Northern hemisphere in particular will be generally more variable with occasional more northerly heat waves and more southerly unusually cold snaps. In the USA hurricanes may strike the east coast with greater frequency in summer and storm related blizzards more common in winter. The southern continents will be generally cooler with more frequent droughts. Arctic and Antarctic sea ice may react differentially to an average global cooling. We might expect sea ice to increase in the Antarctic but in the NH the Arctic Oscillation while bringing cooler temperatures further south may also bring warmer air into the Arctic with possible relative loss of sea ice in that area. The most general advice is that world food production may be subject to occasional serious severe restriction because of cold and drought. The use of food crops for biofuels should be abandoned and stockpiles built up for possible lean times ahead.. Northern cities and transportation systems should prepare for more frequent heavy snow and ice storms. There is no threat from the burning of fossil fuels for the forseeable future, indeed an increase in CO2 would positively help in feeding the burgeoning population. For the next 20 years climate science should be devoted to improving and enlarging the entire climate data base in particular with regard to solar data of all kinds. No climate model runs should be made until 2025 by which time the inputs will hopefully be more relevant to the real world. |
|
|
|
Post by norpag on Jun 13, 2010 18:29:13 GMT
Any responses to the modified thread?
|
|
|
|
Post by sigurdur on Jun 13, 2010 18:39:36 GMT
I would have to say that it has more merit than the IPCC political statement.
|
|
|
|
Post by socold on Jun 13, 2010 19:04:54 GMT
You should add information about the rate of the greenhouse gas increase and the potential range of warming that will induce in the coming century.
|
|
|
|
Post by norpag on Jun 13, 2010 22:14:54 GMT
Socold: The dangerous AGW (CO2) paradigm, the EPA classification of CO2 as a pollutant and the UN move to control carbon emissions are mainly based on the IPCC AR4 Summary for Policymakers. This is a political document which was published before the IPCC WG1 scientific report on which it purports to be based .In some cases the WG1 report was edtited to fit the policy ( cf Bush's intelligence on WMD) In the most important matters the WG1 was simply ignored. The Summary states: "The understanding of anthropogenic warming and cooling influences on climate has improved since the TAR, leading to very high confidence that the global average net effect of human activities since 1750 has been one of warming, with a radiative forcing of +1.6 [+0.6 to +2.4] W m–2 " It goes on to estimate a sensitivity of 3 degrees Centigrade to a doubling of CO2 with a similar high degree of confidence. Compare this certainty with AR4 WG1 Chapter2 on Atmospheric Constituents and Radiative Forcing. www.ipcc.ch/ipccreports/ar4-wg1.htmLook at Fig2.20 on page 203. This first, wrongly assigns all cloud albedo effects to human sources whereas clearly most albedo effects are most probably solar forcings related to cosmic rays. But apart from that attribution, the same figure shows an error bar of about 1.5 W/m2 for cloud albedo which should be multiplied by 2 to allow for the climate efficiency of albedo compared with CO2 shown on the same figure. This gives a possible uncertainty of 3W/m2 twice the effect of CO2 . It makes the claims of degree of confidence in the Summary ridiculous. The IPCC projections are based on models. WG1 section 8.6.4 deals with the reliability of the projections.The IPCC science section on models concludes: "Moreover it is not yet clear which tests are critical for constraining the future projections,consequently a set of model metrics that might be used to narrow the range of plausible climate change feedbacks and climate sensitivity has yet to be developed" What could be clearer. The IPCC itself says that we dont even know what metrics to put into the models to test their reliability.- ie we don't know what future temperatures will be and we can't calculate the climate sensitivity to CO2.This also begs a further question of what mere assumptions went into the "plausible" models to be tested anyway. Nobody ever seems to read or quote the WG1 report- certainly not the compilers of the Summary or the EPA or most western politicians. Those of us interested in objective science should try to see that the WG1 conclusions get as much exposure as possible. They deserves to be on the front page of the NY Times, The Guardian quoted by the BBC and read into the Congressional record in the USA. Because of our ignorance of the natural forcings and feedbacks we simply can't now calculate empirically the effect of anthropogenic CO2. It is not likely to be significant for the next 30 years during which time we should improve our understanding of the climate system as a whole and during which time its effects are more likely beneficial than harmful. |
|
|
|
Post by sigurdur on Jun 14, 2010 3:07:57 GMT
norpag:
Thank you. I had read that long ago.....had actually forgotten it. Am going to have to read WG1 again....just to brush up.
|
|
|
|
Post by glc on Jun 14, 2010 8:09:46 GMT
Of particular note is the negative phase of the PDO which began about ten years ago and may well last for another 20 years.
We've been in a negative PDO phase for 10 years? Yet we've had a warming trend over the past 10 years. Is this not a bit worrying? What happens when the PDO switches back?
|
|
|
|
Post by norpag on Jun 14, 2010 14:08:18 GMT
glc Global temperature data are not of good quality. For purposes of discussion however the CRU SST data is probably as good a measure as any - because of the extent of the oceans and their thermal inertia. This shows that the global temperaure curve rolled over in about 2003. The general curve is perturbed by El Nino events ( 1998 and 2009-10 ). AGW believers like to say that the last 10 years have been the warmest ever. Obviously when you cross a peak the last 5 up steps and the first 5 down steps are the highest. It is not true that there has been a warming trend over the last 10 years. What happens when the PDO switches? At this time we just don't know and should be honest enough to say so.
|
|
|
|
Post by glc on Jun 14, 2010 18:11:58 GMT
glc Global temperature data are not of good quality. For purposes of discussion however the CRU SST data is probably as good a measure as any - because of the extent of the oceans and their thermal inertia. This shows that the global temperaure curve rolled over in about 2003.
Global temperature data are of perfectly good quality. Surface and satellite measurements are in very close agreement over the past 25 years.
It's not clear that sea surface temperatures are actually falling. The trend over the past decade has been more or less flat - unlike the last time (1940s) the PDO went into a cold phase. Like I said, if we really are 10 years into a negative PDO then there is a clear underlying warming trend which is unrelated to the known natural cycles.
|
|
|
|
Post by socold on Jun 14, 2010 20:20:06 GMT
Socold: The dangerous AGW (CO2) paradigm, the EPA classification of CO2 as a pollutant and the UN move to control carbon emissions are mainly based on the IPCC AR4 Summary for Policymakers. The EPA employed scientists to review the science. As part of that the EPA scientists reviewed WG1. As realclimate explains: Finally, a few people have asked why the SPM is being released now while the main report is not due to be published for a couple of months. There are a number of reasons – firstly, the Paris meeting has been such a public affair that holding back the SPM until the main report is ready is probably pointless. For the main report itself, it had not yet been proof-read, and there has not yet been enough time to include observational data up until the end of 2006. One final point is that improvements in the clarity of the language from the SPM should be propagated back to the individual chapters in order to remove any superficial ambiguity. The science content will not change.www.realclimate.org/index.php/archives/2007/02/the-ipcc-fourth-assessment-summary-for-policy-makers/For mere plausibility, even if I hadn't read the above, I would still be very skeptical of your argument anyway because if "they" had fudged the SPM to not reflect the WG1 I would expect them to have done everything to avoid suspicion. So publishing WG1 and the SPM in the exploitable order they did doesn't look like the action of a guilty party. The process of compiling the summary for policymakers (which I've seen mentioned elsewhere) doesn't make that allegation seem plausible. It also casts doubt on them being able to get away making the SPM not reflect the main report. Realclimate again: The process of finalising the SPM (which is well described here and here) is something that can seem a little odd. Government representatives from all participating nations take the draft summary (as written by the lead authors of the individual chapters) and discuss whether the text truly reflects the underlying science in the main report. The key here is to note that what the lead authors originally came up with is not necessarily the clearest or least ambiguous language, and so the governments (for whom the report is being written) are perfectly entitled to insist that the language be modified so that the conclusions are correctly understood by them and the scientists. It is also key to note that the scientists have to be happy that the final language that is agreed conforms with the underlying science in the technical chapters. What is shown is the estimated cloud albedo effect from human aerosol emissions: www.ipcc.ch/publications_and_data/ar4/wg1/en/ch2s2-4-5.htmlwww.ipcc.ch/publications_and_data/ar4/wg1/en/ch2s2-4-5-2.htmlDon't understand why you say it should be multipled by 2. 1.5wm-2 is the estimated radiative forcing. If it needs doubling at any stage for physical reasons, it would already have been done and the result of that is 1.5wm-2. Look at the red probability distribution at the bottom of figure 2.20 labelled total anthropgenic radiative forcing. The SPM says: " very high confidence that the global average net effect of human activities since 1750 has been one of warming, with a radiative forcing of +1.6 [+0.6 to +2.4] W m–2" That's looks like it is entirely based on a 90% confidence range of that probability distribution in figure 2.20. So in this instance at least the SPM text does reflect the main report. They are talking about narrowing the plausible range, they aren't claiming without these tests the plausible range is wide open and anything goes. Yet the SPM reflects the WG1 report: It is likely to be in the range 2°C to 4.5°C with a best estimate of about 3°C, and is very unlikely to be less than 1.5°C. Values substantially
higher than 4.5°C cannot be excluded, but agreement of models with observations is not as good for those values. Water vapour changes represent the largest feedback affecting climate sensitivity and are now
better understood than in the TAR. Cloud feedbacks remain the largest source of uncertainty. {8.6, 9.6, Box 10.2}Well WG1 is compatible with doubling co2 likely causes between 2 and 4.5C warming. The uncertainty has created such a range. If you want to go around telling people that likely range be my guest. |
|
|
|
Post by socold on Jun 14, 2010 20:41:08 GMT
|
|
|
|
Post by icefisher on Jun 14, 2010 21:42:37 GMT
Of particular note is the negative phase of the PDO which began about ten years ago and may well last for another 20 years. We've been in a negative PDO phase for 10 years? Yet we've had a warming trend over the past 10 years. Is this not a bit worrying? What happens when the PDO switches back? If you will note the negative phase of the PDO did not start 10 years ago in almost all liklihood. What was witnessed 10 years ago was a decrease in the forcing the Pacific lays on the globe and is consistent with the slope of warming reducing to almost zero as the PDO actually is now either toe or heel to the zero forcing line. 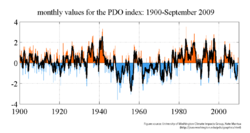 If you look at this graph and compare it to the list of solar cycles and use the world temperature charts to fine tune it (especially around WWI where Pacific records were still sketchy with the US Navy not having an official command there until the 1920's) the PDO appears in tune with cycle minimums every 3rd solar cycle usually situated closer to the minimum than the maximum (roughly 1 to 4 years after the minimum) ENSO phases could easily affect the variation. Is there a connection there? Who knows? But it is interesting with peak global temperatures hitting minimums and maximums on about 32 to 33 frequency about the average length of 3 solar cycles. Phase I: Minimum cycle 11, 12/1878, ending 3 cycle average of 123 and beginning 3 cycles of average 76 and 34.5 years. Cooling trend peak to valley 1978 to 1911 (33 years). No reliable instrument measurement record of Pacific PDO. Phase II: Minimum cycle 14, 8/1913 beginning 3 cycle average of 101 and 30.5 years; global warming (valley to peak) 1911 to 1944, 33 years; PDO shift blurry but appears to be in the 2nd decade of the 20th century. Phase III: Minimum cycle 17: 2/1944, beginning 3 cycle average of 155 and 32.5 years, global cooling (peak to indefinite valley) 1944 to 1976;. PDO shift clearly around 1944/5, 32 to 33 years. Phase IV: Minimum cycle 20, 6/1976 beginning 3 cycle average of and 32.5 years; global warming (valley to peak) 1976 - 1998? (22 years) or 2005? (29 years) or 2010 (34 years? Did peak get whacked by 2008 La Nina?; PDO shift clearly past 1998, maybe 2008 which would be 32 years. But it won't be clear if it is shifting for a while yet.. PhaseV: Minimum cycle 23, 12/2008 At any rate all that is in sync to an accuracy level of about 32.5 years +or that could be explained by a typical 2 year ENSO half phase. So what conclusions can I draw from this. The maximum data set is about 4 phases, not much to go on. But I can conclude that you are premature in declaring the PDO dead and in almost all likelihood did not shift in 1998 though at the time there were definite signs of change (the forcing might have shifted in 1998) but if so zero anomaly as a trend was still well off and that can be seen in the charts. The only thing I am fairly convinced of is that we are likely to learn an awful lot in the next 5 years. So slow down GLC. Go with the flow!! |
|
|
|
Post by icefisher on Jun 14, 2010 21:56:44 GMT
|
|
|
|
Post by poitsplace on Jun 14, 2010 22:14:11 GMT
Its an observable state...the PDO didn't flip until around 2007-2008. The claims that it started around 2000 are nothing but "wishful" thinking. The trend leveled off around 2000 because that's when we ran out of various warm phases to hit warming mode (AMO, PDO, NAO, etc). They haven't come together in a warm phase simultaneously in at least 200 years. |
|
|
|
Post by norpag on Jun 14, 2010 22:37:05 GMT
socold - I suggested doubling the uncertainty because the climate efficacy column on fig 2.20 shows that cloud albedo effect could be up to be twice that of CO2. I agree with icefiisher that the PDO probably flipped later than in my original post - I was just being conservative. As to the SPM - WG1 relationship it was certainly backwards- Your quote from Realclimate more or lessl admits that;
"The key here is to note that what the lead authors originally came up with is not necessarily the clearest or least ambiguous language, and so the governments (for whom the report is being written) are perfectly entitled to insist that the language be modified so that the conclusions are correctly understood by them and the scientists."
In other words they wanted to remove the uncertainties and caveats in the originals.
If that isn't fitting the science to the policy - it comes awfully close.
Anyway my original post was intended to coax members to provide alternative 20 - 30 yr forecastes if they disagree with mine - Then we can see what trend emerges over the next few years.
|
|


