|
|
Post by sigurdur on Sept 6, 2010 0:27:44 GMT
OK.....supposedly co2 has caused .7C of warming since the magic year of 1975.
What was the cause of the warmup that started in the mid 1700's and seemed to last till 1975?
And why are the 48 states of the United States immune to that warmup?
|
|
|
|
Post by flyingmonkey on Sept 6, 2010 7:42:58 GMT
OK.....supposedly co2 has caused .7C of warming since the magic year of 1975. What was the cause of the warmup that started in the mid 1700's and seemed to last till 1975? And why are the 48 states of the United States immune to that warmup? "What was the cause of the warmup that started in the mid 1700's and seemed to last till 1975?" According to Charles A. Perry and Kenneth J. Hsu , it was solar variability www.pnas.org/content/97/23/12433.full2nd graph www.pnas.org/content/97/23/12433/F2.large.jpgThe United States had not really been immune to that warm up- the newer models will explain away any historical discrepancy by pointing out that the average American grew much taller over the last 100 years, so the height they view thermometers on fence posts changed; when you re-model considering the viewing angle error, by changing past temperature readings , the models become even more accurate.......... (: |
|
|
|
Post by poitsplace on Sept 6, 2010 9:18:46 GMT
It hasn't really even warmed .7C since the 1880s warming peak...and only .4C since the 1940s warming peak.
...but yeah, the fact that the US has been immune to the warming does make one wonder.
|
|
|
|
Post by hunterson on Sept 6, 2010 12:15:48 GMT
It hasn't really even warmed .7C since the 1880s warming peak...and only .4C since the 1940s warming peak. ...but yeah, the fact that the US has been immune to the warming does make one wonder. And even measuring temperatures as the metric of warming is not a very good use of time for many reasons. |
|
|
|
Post by steve on Sept 6, 2010 14:13:41 GMT
It hasn't really even warmed .7C since the 1880s warming peak...and only .4C since the 1940s warming peak. ...but yeah, the fact that the US has been immune to the warming does make one wonder. And even measuring temperatures as the metric of warming is not a very good use of time for many reasons. The US is not immune to the warming as it has warmed over time. Just because it was warmer for a year or two in the 1930s and warmer in a few states doesn't mean it hasn't warmed on average overall in the past 100 years or so (which it has). Global warming since 1975 is not 0.7C - it was about that for the whole 20th Century. Hunter is maybe making the point that looking at one metric won't tell the whole story. It's a bit strong to say it is a waste of time. At the moment we are observing surface station temperatures, sea surface temperatures, ocean heat content and lower tropospheric temperatures all trending upwards. The longer the datasets the better the understanding of the collective data. The reason why the dodgy records of no warming in the early satellite record of the lower troposphere were discounted was because they just did not square with the other data and knowledge. Subsequently the problems were diagnosed. |
|
|
|
Post by icefisher on Sept 6, 2010 15:45:45 GMT
The US is not immune to the warming as it has warmed over time. Just because it was warmer for a year or two in the 1930s and warmer in a few states doesn't mean it hasn't warmed on average overall in the past 100 years or so (which it has).
Global warming since 1975 is not 0.7C - it was about that for the whole 20th Century.
Hunter is maybe making the point that looking at one metric won't tell the whole story. It's a bit strong to say it is a waste of time. At the moment we are observing surface station temperatures, sea surface temperatures, ocean heat content and lower tropospheric temperatures all trending upwards. The longer the datasets the better the understanding of the collective data. The reason why the dodgy records of no warming in the early satellite record of the lower troposphere were discounted was because they just did not square with the other data and knowledge. Subsequently the problems were diagnosed. The US has primarly been experiencing value-added warming.  |
|
|
|
Post by steve on Sept 6, 2010 17:06:54 GMT
Icefisher,
The reason for these adjustments is well-described in the literature going back long before 1999. The trend has gone up mostly due to dealing with the fact that times of observations have changed systematically, and the fact that sites have moved to places with less of an urban influence, and it has been reduced down by accounting for increased urban warming.
|
|
|
|
Post by icefisher on Sept 6, 2010 18:04:02 GMT
Icefisher, The reason for these adjustments is well-described in the literature going back long before 1999. The trend has gone up mostly due to dealing with the fact that times of observations have changed systematically, and the fact that sites have moved to places with less of an urban influence, and it has been reduced down by accounting for increased urban warming. Correct Steve all determined by a frothing at the mouth politician with scientific guidance on how far one can extrapolate in one direction. |
|
|
|
Post by slh1234 on Sept 7, 2010 4:13:02 GMT
I'm going to have to start a separate "Glacier" thread when I get back (not that I have that much to contribute, but would like the discussion). I always expect to learn something new on any excursion, and the trip today to Mendenhall Glacier was no exception.
A few things said by ragers or placards (I have pictures of the placards) included:
1. In their film, they put the start of the little ice age about about 3,000 years ago. That is different from what I've read before.
2. In the film at the visitors' center, they put the maximum extent of the Mendenhall Glacier at about 250 years ago. At that time, warming reversed the trend for glaciers in the Pacific Northwest and elsewhere.
I have a lot more stuff I either noted from the film, took pics of on placards, or spoke to rangers about. I will post when I get back (Forgive me if I want to get out and live while here ... I'll have time to post here later)
|
|
|
|
Post by Pooh on Sept 7, 2010 5:08:18 GMT
Icefisher, The reason for these adjustments is well-described in the literature going back long before 1999. The trend has gone up mostly due to dealing with the fact that times of observations have changed systematically, and the fact that sites have moved to places with less of an urban influence, and it has been reduced down by accounting for increased urban warming. Golly, Steve, Joseph D' Aleo, CCM (usually a reliable and informed source) must have got it backwards. D’Aleo, Joseph. Progressive Enhancement Of Global Temperature Trends. Original Paper. SPPI Original Paper, July 21, 2010. scienceandpublicpolicy.org/images/stories/papers/originals/progressive_enhancement.pdfThe result of the changes has been to cool off the early and middle part of the record to accentuate the apparent warming trend. The anomalies are also affected. The base period for NASA to compute averages is 1951 to 1980. They lowered the average by about 0.115C or 0.207F. This increases the recent positive anomalies. Notes on causes:GISS: For data prior to around 1980 (base period of anomaly 1951 through 1980. Effect "lowered the average by about 0.115C or 0.207F. This increases the recent positive anomalies.") The cooling of the base period for CRU (1961 to 1990) was 0.092C (0.16F). 1 Cooling of the early temperature record (data) "The result of the changes has been to cool off the early and middle part of the record to accentuate the apparent warming trend. The anomalies are also affected. The base period for NASA to compute averages is 1951 to 1980. They lowered the average by about 0.115C or 0.207F. This increases the recent positive anomalies." 2. Global observation stations dropped 3. Increased missing months data 4. Urbanization and land use changes not represented "NOAA USHCN saw a change in 2007 that removed an urban adjustment and produced this annual change in US temperatures."
"We are working on a GHCN global change analysis. (Davis, CA, Closest Rural Site to SFO) 5. Poorly sited observation stations and inadequate / inappropriate sensors within them |
|
|
|
Post by northsphinx on Sept 7, 2010 6:42:41 GMT
Big ice age rebound: en.wikipedia.org/wiki/Post-glacial_rebound"The present-day uplift motion in northern Europe is also monitored by a GPS network called BIFROST[1][10][11]. Results of GPS data shows that a peak rate of about 11 mm/year exist in the north part of the Gulf of Bothnia, but this uplift rate decreases away and become negative outside the former ice margin. In the near field outside the former ice margin, the land sinks relative to the sea. This is the case along the east coast of the United States, where ancient beaches are found submerged below present day sea level and Florida is expected to be submerged in the future. GPS data in North America also confirms that land uplift becomes subsidence outside the former ice margin"  Must be man made CO2 causing this as well. Or at least have to be blamed to mankind. |
|
|
|
Post by steve on Sept 7, 2010 10:26:47 GMT
I have to disagree. There was no substance to the document you linked to other than implications of underhand tactics. The various methods are discussed in the various papers, and could be analysed by other people if they could be bothered. Given that different analyses with different subsets of the data give similar results, the lack of a substantial sceptic case made up of an alternative analysis suggests to me that there is no case to answer.
Joseph D'Aleo is a frothing at the mouth sort of person - eg. his latest piece opens "Phil Jones admitted to the BBC that there was no statistically significant warming since 1995 and that it had cooled globally 0.12C from 2002 to 2009, not statistically significant but nonetheless a cooling" which is a completely stupid statement that has been repeated ad nauseum for months by many people despite explanations as to why it is stupid.
The reason that the positive warming trend was only significant to the 94% level rather than the 95% level required for "statistical significance" (big deal!) was *because* of the insignificant "cooling" from 2002-2009 that Joe makes such a big thing of - mathematical ignorance combined with double-counting of a cool period and double-standards for "insignificant warming" vs "insignificant cooling".
|
|
|
|
Post by icefisher on Sept 7, 2010 12:15:08 GMT
I have to disagree. There was no substance to the document you linked to other than implications of underhand tactics. The various methods are discussed in the various papers, and could be analysed by other people if they could be bothered. Given that different analyses with different subsets of the data give similar results, the lack of a substantial sceptic case made up of an alternative analysis suggests to me that there is no case to answer. Joseph D'Aleo is a frothing at the mouth sort of person - eg. his latest piece opens "Phil Jones admitted to the BBC that there was no statistically significant warming since 1995 and that it had cooled globally 0.12C from 2002 to 2009, not statistically significant but nonetheless a cooling" which is a completely stupid statement that has been repeated ad nauseum for months by many people despite explanations as to why it is stupid. The reason that the positive warming trend was only significant to the 94% level rather than the 95% level required for "statistical significance" (big deal!) was *because* of the insignificant "cooling" from 2002-2009 that Joe makes such a big thing of - mathematical ignorance combined with double-counting of a cool period and double-standards for "insignificant warming" vs "insignificant cooling". Here are some of the papers Steve: scienceandpublicpolicy.org/images/stories/papers/originals/surface_temp.pdfAnd of course this climategate email spanning the US and UK requesting from CRU some additional downward adjustments to 1940's blip: From: Tom Wigley <wigley@xxxxxxxxx.xxx>
To: Phil Jones <p.jones@xxxxxxxxx.xxx>
Subject: 1940s
Date: Sun, 27 Sep 2009 23:25:38 -0600
Cc: Ben Santer <santer1@xxxxxxxxx.xxx>
<x-flowed>
Phil,
Here are some speculations on correcting SSTs to partly
explain the 1940s warming blip.
If you look at the attached plot you will see that the
land also shows the 1940s blip (as I'm sure you know).
So, if we could reduce the ocean blip by, say, 0.15 degC,
then this would be significant for the global mean -- but
we'd still have to explain the land blip.
I've chosen 0.15 here deliberately. This still leaves an
ocean blip, and i think one needs to have some form of
ocean blip to explain the land blip (via either some common
forcing, or ocean forcing land, or vice versa, or all of
these). When you look at other blips, the land blips are
1.5 to 2 times (roughly) the ocean blips -- higher sensitivity
plus thermal inertia effects. My 0.15 adjustment leaves things
consistent with this, so you can see where I am coming from.
Removing ENSO does not affect this.
It would be good to remove at least part of the 1940s blip,
but we are still left with "why the blip".
Let me go further. If you look at NH vs SH and the aerosol
effect (qualitatively or with MAGICC) then with a reduced
ocean blip we get continuous warming in the SH, and a cooling
in the NH -- just as one would expect with mainly NH aerosols.
The other interesting thing is (as Foukal et al. note -- from
MAGICC) that the 1910-40 warming cannot be solar. The Sun can
get at most 10% of this with Wang et al solar, less with Foukal
solar. So this may well be NADW, as Sarah and I noted in 1987
(and also Schlesinger later). A reduced SST blip in the 1940s
makes the 1910-40 warming larger than the SH (which it
currently is not) -- but not really enough.
So ... why was the SH so cold around 1910? Another SST problem?
(SH/NH data also attached.)
This stuff is in a report I am writing for EPRI, so I'd
appreciate any comments you (and Ben) might have.
Tom.
|
|
|
|
Post by socold on Sept 7, 2010 12:57:54 GMT
Golly, Steve, Joseph D' Aleo, CCM (usually a reliable and informed source) must have got it backwards. He isn't a reliable source. Page 1Recently we shared a story in the Wall Street Pit how NASA has gradually reduced the warm middle 20th century blip and created a more continuous warming.The story on the Wall Street Pit was also wrong. That story came from joannenova.com.au. That too was wrong. Steve Goddard made the same error on WUWT just last week. Wrong again. None of these chains of "skeptics" spotted the error. Page 1 of D'Aleos PDF: The story showed three Hansen plots of global temperatures from 1980, 1987 and 2007 (above). The 1960s started out 0.3C colder than the 1950s in 1980, dropped to 0.05C colder by 1987 and was actually warmer by 0.05C in 2007.This is essentially the same mistake Steve Goddard made a week ago. The Hansen plot from 1980 and 1987 is meteorological stations only. But the 2007 plot is land+ocean. Apples and oranges. On page two he overlays the records but doesn't account for the 1980 and 1987 graphs having different baselines. Here's the 1980 graph overlaid on GISTEMP from 2010 for a proper comparison: 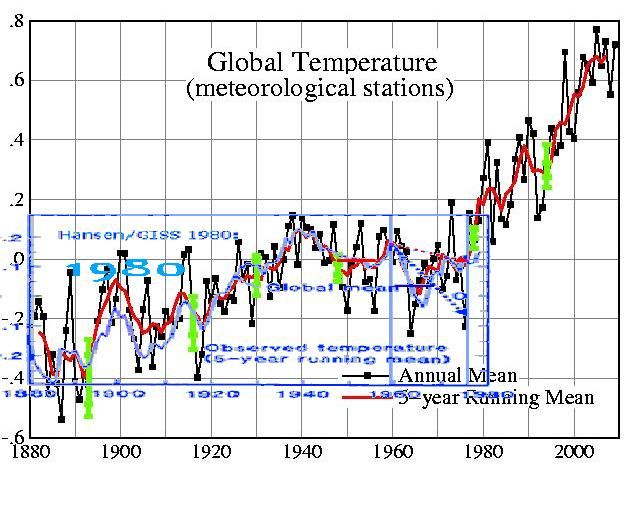 Quite clearly GISTEMP hasn't changed appreciatively since 1980, therefore destroying D'Aleos entire thesis that it has. |
|
|
|
Post by socold on Sept 7, 2010 13:16:40 GMT
I have to disagree. There was no substance to the document you linked to other than implications of underhand tactics. More importantly the"comparison of GISS" and "comparison of CRU" graphs D'Aleo used were flat out wrong. He compared apples to oranges in both cases, didn't adjust correctly for changes in baseline and referenced the data sloppily (GISTEMP 1980 should be referenced as Hansen et al 1981. "CRU" is not a dataset. He should have cited either CRUTEM or HadCRUT or preferably a paper. At the very least he should have indicated where he got the graph from) It's amusing to D'Aleo throwing stones in a glasshouse. He should throw around the "fraud" and "deception" words a little less given that his own "publications" could be charged with the same words if we were as willing to don the conspiracy tined glasses that D'Aleo wears. Exactly and D'Aleo should have done that at a minimum before spouting off. He should also compile a station record himself - or at the very least cite the various other people that have done this - to show what the result "should be" in his view. He doesn't even cite the papers let alone show any indication he's read them. Presumably he pulled the "CRU 2001" graph from somewhere, but we are not told where! Did he read Jones et al 1999? that has an earlier graph. ( seaice.apl.washington.edu/Papers/JonesEtal99-SAT150.pdf). On page 178 there is a global temperature graph little different than modern HadCRUT3. Nothing like what D'Aleo posted and claimed was from 2001. So you have to wonder... |
|


