|
|
Post by sigurdur on Dec 24, 2010 15:16:21 GMT
Merry Christmas.
In thinking of the current Arctic temperatures, we have recent history of temperature similar to these during the 1930 thru mid 1940 period.
I think this bears examination as to the effects to worldwide weather/climate then verses the effects today.
The main difference is not sea ice extent. The sailing of the northern passage in 1944 by the St. Roch and the sailing of the North East passage by German warships shows that the ice extent was at lows then as well.
Temperatures seem to have been very similar to the temperatures of today.
What was different? And bears examination? The phase of the sun. During the 1930's and early 1940's, we were about 1/2 way through a Grand Maximum. Today, we are in the early phase of a Grand Minimum as Livingston and Penn is showing.
The change of the jet stream caused by UV, and the change in cloud cover caused by GCR's is changing our perception of current climate. In fact, it is not only changing perception, it is reality.
Albedo charts of the earth show more reflection. The only cause of this has to be more clouds. Total ice coverage of earth has not changed very much. The Arctic is lower in the summer, but this has been offset by the increase in ice area in Antarctica.
Just a few random thoughts that I believe bear investigation by the great minds present here.
|
|
|
|
Post by jurinko on Dec 24, 2010 21:11:53 GMT
Compare the Greenland ground stations:  The 1920-1940 period is an exact copy of 1990-2010 period. Then winter CET record with similar periods compared: 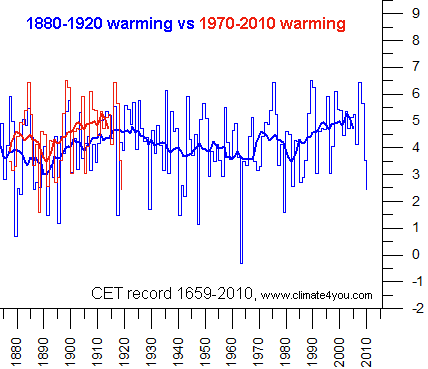 Future looks cold. Just saying'. |
|
solarstormlover54
Level 2 Rank
 Hot and dry trend Since January. Looks to continue at least through the first half of May.
Posts: 54
|
Post by solarstormlover54 on Dec 24, 2010 21:36:10 GMT
In my area the 1930s, and 1940s were marked with severe drought. Known as the "dirty 30s" caused a lot of farmers to go broke and likely caused urbanization on the plains.
The last 10 years do in fact show frequent drought though a small break every 2 or 3 years. Such Breaks were 2004, 2005, and 2010 when the summers were generally soaking wet. The worst drought years this century ware in order. 2009,2002,2003,2001, and 2006.
Some of the notable years in my area the 30s and 40s were...
1924: in some areas the hottest day in July(near 38C/100F)) was followed by the coldest night ever(near -50C/-58F) in December
1931: A February as warm as April. Not one day fell below freezing and many days as high as 18C(65F)
1936: 45C/113F(Canada's highest ever Temperature) set in Saskatchewan. Up to 7C warmer than normal in spots
1937: 37.2C(98F) in June in Edmonton
1938: still the hottest September ever. 8C warmer than normal
1939: 32C(90F) in April followed by a hot summer.
1941: More areas see 37C(98F) during a July that was up to 6C above normal.
|
|
|
|
Post by boxman on Dec 24, 2010 22:17:28 GMT
|
|
|
|
Post by sigurdur on Dec 24, 2010 23:08:40 GMT
Jurinko:
Are both of the parts of the graph CNET from CNET records? The correlation is astounding to say the least!
|
|
|
|
Post by sigurdur on Dec 24, 2010 23:21:34 GMT
This is getting very interesting already. Norway warmer, CET showing almost a mirror image, Alberta showing a lot of the same conditions that ND has experienced the past 10 years.
It is patently obvious that there is a 60 year cycle in play. Now I wonder, are there other longer cycles that are merging with the 60 year cycle?
And how in the world do our climatologists miss this obvious question? And the similiarity to past happenings to what is occuring today? Are they history dumb?
|
|
|
|
Post by AstroMet on Dec 25, 2010 0:58:14 GMT
This is getting very interesting already. Norway warmer, CET showing almost a mirror image, Alberta showing a lot of the same conditions that ND has experienced the past 10 years. It is patently obvious that there is a 60 year cycle in play. Now I wonder, are there other longer cycles that are merging with the 60 year cycle? And how in the world do our climatologists miss this obvious question? And the similiarity to past happenings to what is occuring today? Are they history dumb? The 60-year cycle also has 120-yr., and 36-yr. cycles in play. These are planetary. Remember the rule that astronomical forces are the drivers of Earth's climate cycles. Every 20 years there is a Jupiter-Saturn conjunction, depending on their positions in the zodiac relative to Earth we see correlating climate events of the past similar to those present. There are cycles within cycles, lunar cycles that affect our weather, and the primary velocities and conditions of the Sun which drives it all. According to Dr. Nicola Scafetta: "The sunspot cycle also presents a bi-modality with periods that
oscillate between 10 and 12 years, that is between the opposition-
synodic period of Jupiter and Saturn and the period of Jupiter,
respectively (Wilson, 1987).
Two large temperature cycles (#5 and #6) are present within this spectral range. Ogurtsov et al. (2002) found evidences for a 60–64 year period in 10Be,14C and Wolf number over the past 1000 years.
Ogurtsov et al. found 45-year cycles, 85-year cycles plus bi-secular cycles in the solar records. These findings indicate that Jupiter, Saturn, Uranus and Neptune modulate solar dynamics.See Dr. Nicola Scafetta's 2010 paper on this here -> arxiv.org/PS_cache/arxiv/pdf/1005/1005.4639v1.pdf |
|
|
|
Post by sigurdur on Dec 25, 2010 2:30:35 GMT
Thank you Astromet. It is good to see you posting published literature to reference what you say.
The AGW subject is far from settled, and the repeat of the 1930-mid 1940 warm phase of the Arctic bears investigation.
|
|
|
|
Post by jurinko on Dec 25, 2010 8:16:02 GMT
Hi Sigurdur, the Central England Temperature (CET) graph is from here: www.climate4you.com/CentralEnglandTemperatureSince1659.htmNAO index is well correlated with European winters, AMO index with summers. NAO runs in 80-year period, AMO in 60-years period. While NAO peaked in 20ties and AMO in 40ties, lately they peaked both in 90ties/00ties, close to each other. NAO is going south already and AMO soon to follow. Such combination of cold PDO, AMO, NAO and sun activity is a pretty much recipe for unprecedented cooling. Maybe it has already started: northern extratropics.  |
|
|
|
Post by sigurdur on Dec 25, 2010 17:13:28 GMT
I do think the cooling has started. Not only in Europe, but North America as well.
North America seems unique in that it didn't warm as much as the rest of the world. Of course, that may be because we are pretty saturated with thermomiters.
Our warmest decade by far has been the 1930's decade.
It now seems that New Zealand has not warmed a whole lot either, and for sure not unprecedented warming.
The whole AGW thing is starting to get even smellier as time goes on. While co2 has to contribute somehow, it is becoming more apparant each day/year/decade that it is not as strong a contributor as some would have us believe.
|
|
|
|
Post by socold on Dec 25, 2010 17:32:29 GMT
Considering ENSO has declined since 2003 and we've descended into a deep solar minimum I think global temperature really should have cooled in recent years. But even hadCRUT shows it as being flat. Therefore I think a warming effect must have countered the ENSO and solar cooling of recent years and I think that warming effect is the longterm warming we've seen since the 70s continuing on. If something had flipped within the last few years I would have expected this chart to diverge, but so far just calculating global temperature on a background warming trend + solar cycle + ENSO is still working: 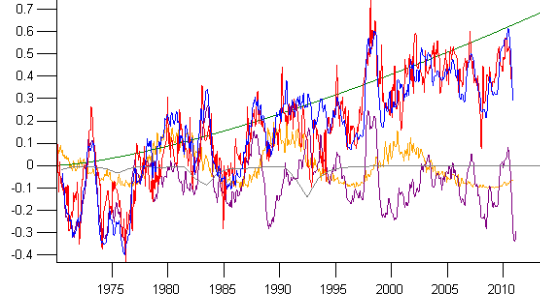 As neither the purple (ENSO) nor the solar cycle (orange) are going to get any lower I think an obvious jump up in global temperature will be visible in all records within a matter of years, perhaps even one year. Hansen is predicting 2012 will be a record year for similar reasons and I think that's pretty likely too as long as we return back to ENSO neutral in 2011. 2011 itself won't make it because the current La Nina will be imposed on it. I can throw some numbers in for future solar cycle and ENSO and this shows such a step change about to happen. I've picked a particularly deep and long La Nina and a low solar cycle 24 and no strong El Ninos until 2025, so this is very conservative in terms of what could happen:  What's interesting is to look at the blue line. Nothing draws my eye to the period 2000-2010. It doesn't look out of place in the longterm warming trend. In hindsight we might not even understand what all the fuss was in 2010 about warming slowed down. The 2010 topic of whether warming from since 1995 is statistically significant would sound bizarre. If this step change does happen I wonder whether in future flat periods skeptics will claim warming has ended and cooling is on it's way. For example on the blue line I notice 2012-2022 is another flat period. In 2022 will skeptics be claiming warming has stopped? Well that's a discussion that can wait until after the step change has occurred around 2011/2012 (or not! if it doesn't happen I believe that would be sufficient evidence that the world has stopped warming) |
|
|
|
Post by jurinko on Dec 25, 2010 17:45:37 GMT
Socold, up to now global temperatures followed oceans. Atlantic and Pacific are entering the cold phase. What makes you think, that they are going to stay in warming phase forever?
|
|
|
|
Post by sigurdur on Dec 25, 2010 17:54:38 GMT
Socold:
If I could figure out how to post a picture, I would show you that we have changed directions as far as temperature goes.
Also, you pick the 1970's as the start point of the warming. That is not a good pick. Take a look at HadCrut data and draw a line from the 1850's to 2010 on each peak. This would be considered the "normal" range for the current warm period.
Now, use what is called a channel graph feature. This is used in commoddities all the time to show change in direction of a trend. The trend change is glaringly obvious.
I will use the anology of an ice cube for earth. You do not melt an ice cube in a matter of minutes, just as you do not change the heat content of earth in a year or two. There is a lag in both directions + and -.
The anomoly for long term is approx 3. We went over that anomoly in the recent past, but we are at or below it again today. The appex of temperature seems to have occured in the late 1990's, early 2000's. Since that time we have been losing more heat than we have gained. As to be expected.
The albedo of earth has gone up, this ties in well with Svensmarks theory which early results from CERN are supporting. I write this as only early resutls.
We are in a period of cooling right now. Co2 has not overcome that cooling no matter what Dr. Hansen says. His credibility is about zero anymore as his agenda has overtaken his scientific ability to observe, digest, and THEN speak.
The reason for this thread is to show that the warm period of the 30's and 40's is very similiar to the warm period of the 90's and early 2000's.
There are a lot of forces at play in climate. Co2 is one of them, but as I said, it is a minor force, not a major one.
Let us learn from to past so that we can plan for the future. As a farmer one of my large concerns if food availability. During past periods of cooling, that became a huge issue. Remember 1973 and Russia? Having to import massive amounts of grain? They had the money to do so. Most of the rest of the world does not have the money to import to overcome hunger. The global unrest because of the large increase in population is going to be severe. I am old enough to remember cycles. William Herschel, with the limitied availability of good sunspot data, saw that grain prices and sun cycles were intertwined.
There is compelling evidence to plan for a cold future. Notice the change in AGW folks now. Now the cold is caused by co2, it is now climate disruption rather than warming as the warming has left the planet. All the changes show how weak the science actuallly is in the GAWG theory.
And remember this, co2 peaks long after temperatures have dropped. This has happened cycle after cycle and shows how poor co2 is at regulating the climate. Water vapor plays that roll and the forces that change water vapor are what we need to be looking at/for.
|
|
|
|
Post by AstroMet on Dec 26, 2010 0:33:46 GMT
Thank you Astromet. It is good to see you posting published literature to reference what you say. The AGW subject is far from settled, and the repeat of the 1930-mid 1940 warm phase of the Arctic bears investigation. Sure Sigurdur, no problem. I do post literature related to astronomic forcing of the climate/weather so others can begin to look where the causes of all climate on Earth comes from, and that is outer space. As for the 1930s warm phase. This is related to the condition of the Sun and the modulating planets. Signals after a Saturn-Uranus-Pluto T-Square in the early 1930s pointed to blasting dry storms, especially in the mid-western U.S. that lasted to the mid-1930s, more or less. It was also a very windy decade, hot and dry. Some of the hottest temperatures recorded in the U.S. occurred during this decade. During the 2010s, we should continue to witness the transition between global warming and global cooling. In my estimation, I calculated that the global warming cycle we've been in since 1981 will end by 2017, the year we start a new global cooling cycle that will last for 36-years. This new decade is transitional. Meaning we will experience increasing events of cooler anomalies but with temperature extremes from hot to colder than normal. This is consistent features of a transitional climate from global warming to global cooling. Computer models created to match periods must include astronomic signals, or little will be learned as to what is next. The astronomic signals I've read from 2011 to 2017 show transition in play, with global warming winding down. This certainly means more warming signals reflective of higher than normal warm temperatures, etc., but these will be the last six years of this global warming cycle. The Earth never has "warmed forever." That is impossible. All climate is solar forced, with magnetic resonances and vibrational rates of the Sun modulated by the motions of the planets. Global cooling is certainly on the way. We won't officially begin this cycle until 2017, but we've seen the anomalous cooling signs since 2005 worldwide that shows us where the climate trend is heading. World cooling is much more dangerous than global warming ever will be. The politically popular brouhaha around man-made global warming and "climate change" was nothing but generational ideological bullshit centered on money, career and pseudoscience passing off as the real thing. What we've got coming is much more serious than global warming. With global cooling, storms are stronger, damaging, with cooler temperatures very costly to agriculture and energy production. The idea is to refit for this new climate change, brought on by conditions in space which allows the cold of space to persist deeper into the Earth's upper atmosphere. Condensation of the troposphere means cloudier weeks, a wetter, but also colder climate, so storms are stronger by force. The cooler temperatures worldwide means we have about six years before the official onset of global cooling. |
|
|
|
Post by stranger on Dec 26, 2010 1:17:04 GMT
Before you get too deeply into comparing the hot, and dirty, 1930's and their slide into the bitterly cold 1940's; remember that the sun was at as close to a constant state of total flux emission as stellar objects are likely to get.
This time around we have the further complication of solar emissions in decline. Of course, as hot and massive as Sol is, it takes a while to cool. Just as it takes the oceans time to release stored heat when the energy infall declines. Both events complicated by matters tendency to give up heat abruptly, causing a maddening fall/stop/fall series of seasons.
So take your local 1940's weather report for the day, and shave a few degrees off for the sun. How many degrees to take? I will not be around to collect - but my bet is for 4 F. With correspondingly shorter growing seasons. If the temperature drops much below that, we are probably in for another very real ice age.
Stranger
|
|