|
|
Post by twawki on Nov 3, 2008 6:53:59 GMT
I wonder how long it will take for them to look like complete idiots then if the cooling continues and deepens which is likely considering all the contributing factors.
|
|
|
|
Post by nautonnier on Nov 3, 2008 11:01:56 GMT
Close, but a bit vague There is no way to experimentally prove/disprove things that happened in the past. This covers past climate change, the many theories of evolution, creation, the existence/non existence of God(s) etc. In all these areas we need to accept that we have learned or have an innate bias from our education, upbringing and the ways our brains are wired! Which all means that we should respect each others vewpoints. While having a robust discussion, and taking the mickey out of each other! ;D "...and the ways our brains are wired... " Funny you should put it that way. Cogito, ergo sum! You realize, of course, that when it comes right down to it, both the creationist and the evolutionist have the very same problem in explaining the origins of consciousness and existence. Perhaps it's true that the passion of the evolutionist is derived from his rejection of the idea of owing his existence, and therefore some responsibility and gratitude, to the Supreme Being who created him, but that still doesn't negate the question of origin. Back to the brain... astronomers were expecting the arrangement of the bits and pieces of the Universe to be somewhat... chaotic, due to the Big Bang. Surprised they were to discover recently that there's quite an interesting structure in the arrangement of the stars and galaxies. In fact, it resembles that of a brain cell: centripetalnotion.com/2006/09/04/00:23:27/42 |
|
|
|
Post by kiwistonewall on Nov 3, 2008 11:07:18 GMT
Yes, that is the answer! But what is the question? ;D
|
|
|
|
Post by pidgey on Nov 3, 2008 15:49:39 GMT
Yes, that is the answer! But what is the question? ;D Unfortunately, the Earth hasn't finished running the program yet... ...and the Vogons are definitely en route! (but their color isn't yellow... it's green!) |
|
|
|
Post by walterdnes on Nov 5, 2008 5:07:19 GMT
|
|
|
|
Post by twawki on Nov 5, 2008 10:52:51 GMT
great link and discussion WD looks like all the signs are falling into place - will this be a strong la nina? From the site link above;
"There are several other ENSO indices that are kept up-to-date on the web. Several of these are tracked at the NCEP website that is usually updated around the same time as the MEI, but not in time for this go-around. Niño regions 3 and 3.4 showed persistent temperature anomalies of -1.3C or lower from September (region 3) and October 2007 (region 3.4) through February 2008, but have warmed up considerably since then. Weekly SST data shows that the warming may have peaked in August, with an erratic cooling trend since then, leaving the Niño 3.4 index below 0C since late August, while the Niño 3 index dropped below 0C by the end of October. For extended Tahiti-Darwin SOI data back to 1876, and timely monthly updates, check the Australian Bureau of Meteorology website. This index caught on to the current La Niña event last November, reaching +12 to +14 (1.4 sigma) in December, January and March, and higher yet (+21) in February. The average for February-March (+16.8) was ranked fourth highest for that season (since 1950, but this ranking is true for the full record as well). It then hovered near 0 from April through July, while the August SOI rebounded right up to +9, followed by +14 in September and +13 in October, almost one and a half standard deviations in La Niña territory. The last time this index was this high at this time of year was in 1988, right in the middle of a strong La Niña event. An ever longer Tahiti-Darwin SOI (back to 1866) is maintained at the Climate Research Unit of the University of East Anglia website, however with less frequent updates (currently more than one year behind). Extended SST-based ENSO data can be found at the University of Washington-JISAO website, currently updated through April 2007. "
|
|
|
|
Post by twawki on Nov 6, 2008 4:25:47 GMT
|
|
|
|
Post by daffyduck on Nov 7, 2008 13:34:53 GMT
|
|
|
|
Post by alex4ever on Nov 7, 2008 16:02:00 GMT
i do not see any such thing in these animation. the anomaly map show no significant cooling in atlantic. or am i wrong looking at it maybe.
|
|
|
|
Post by twawki on Nov 8, 2008 0:15:32 GMT
as quoted from; icecap.us/"La Nina is gradually returning. The Multivariate ENSO Index (MEI) has dropped to -0.74 in October, well into weak La Nina territory. The tropical Pacific sea surface temperatures all the way from South America to beyond the dateline are back below normal. The North Pacific as a whole remains strongly in the cold mode (negative PDO). The Atlantic is weakly in its warm mode (Atlantic Multidecadal Oscillation is positive). The sun recently showing slight signs of life is still at solar minimum levels. The winds in the stratosphere over the tropical Pacific are blowing anomalously westerly) in their Quasi Biennial Oscillation. All these conditions point to another cold winter in all but the southeastern United States, most of central and western Canada, most of western Europe, eastern and southern Asia. Expect a coolish summer in South Africa, Indonesia and South America and parts of New Zealand and Australia. " 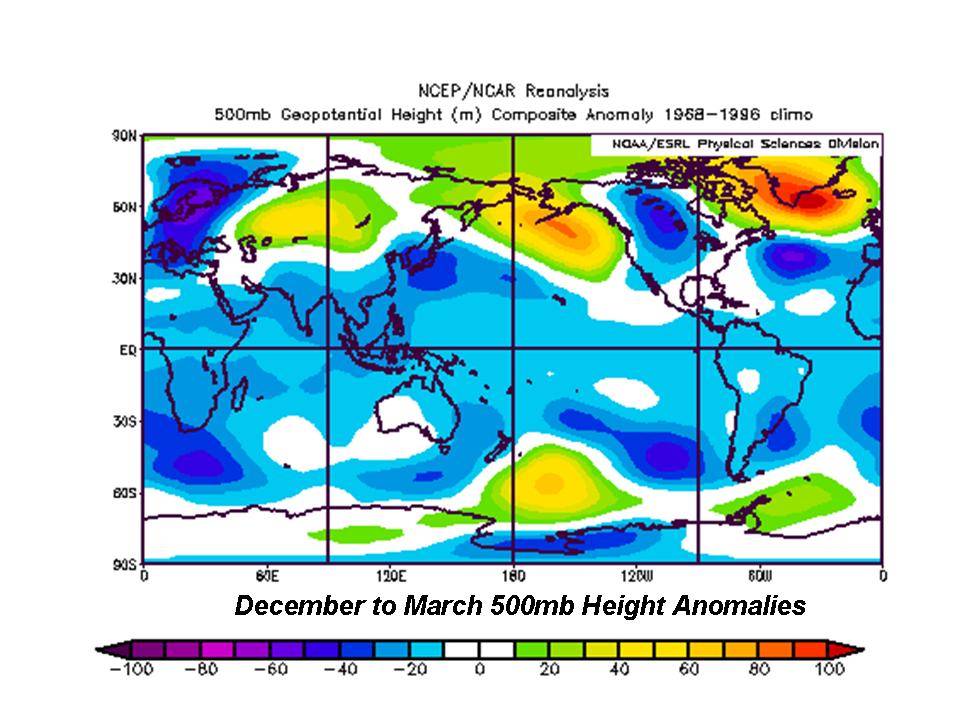 |
|
dresi
Level 3 Rank

Posts: 120
|
Post by dresi on Nov 8, 2008 7:16:08 GMT
Can anyone explain me this map? What does it show?
|
|
|
|
Post by twawki on Nov 8, 2008 7:34:02 GMT
the graph shows 500 millbar height anomalies - anomalies as in deviations from the standard - where there is a negative anomaly it shows cooling where a positive anomaly it shows warming. 500 mb charts depict conditions in the middle troposphere (roughly 5000 meters). ww2010.atmos.uiuc.edu/(Gh)/guides/maps/fcst/5tmphght.rxmlSo what the graph is saying is at approx. 5km high we are seeing significant cooling in the atmopshere |
|
|
|
Post by twawki on Nov 8, 2008 7:39:13 GMT
The anomaly was from Dec 2007 to March 2008 USA surface temp. anomaly as follows; 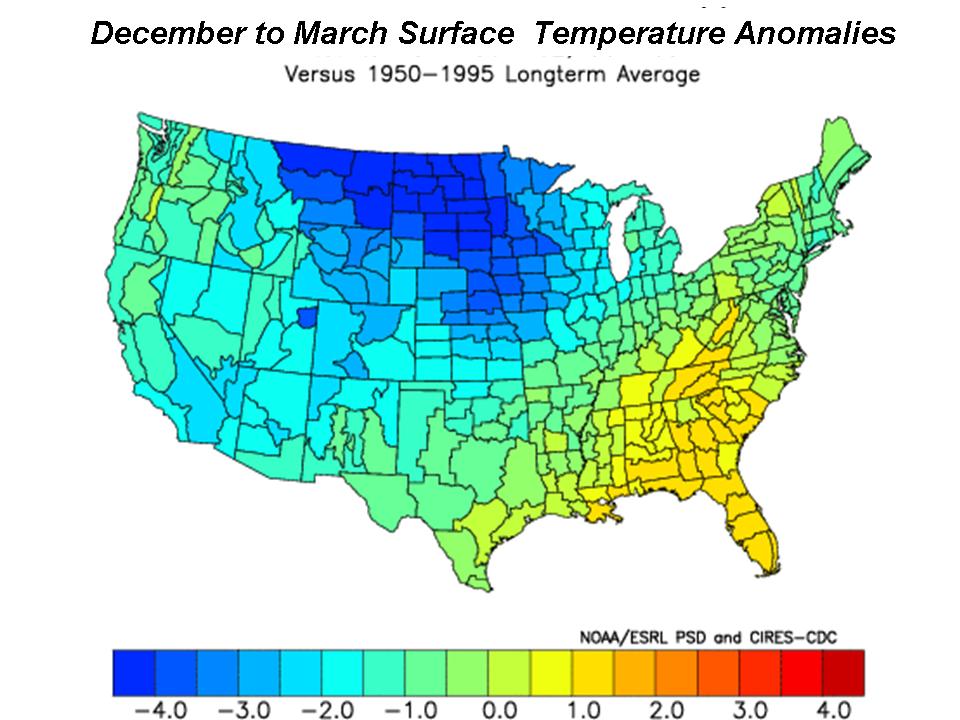 |
|
dresi
Level 3 Rank
Posts: 120
|
Post by dresi on Nov 8, 2008 7:44:19 GMT
Thank you for explanation. So I hope, that we will have finally normal winter here in central Europe  |
|
|
|
Post by twawki on Nov 8, 2008 8:54:05 GMT
Prediction is for colder in western europe - unsure what la nina brings to eastern europe - where abouts are you?
Either way keep us informed - always better to get first hand reports
|
|


