|
|
Post by graywolf on Feb 14, 2018 11:19:13 GMT
I remember there was an article posted here some time back identifying the source area of such air masses as Mongolia? Launch mechanism still unknown? Genghis's revenge. Yes - I posted the article. It was showing that SSW were formed by a meridonal jetstream running up over the Himalayas and the Tibetan plateau and the 'orographic' uplift results in the jetstream rising through the low winter troposphere then breaking like a wave in the stratosphere and flowing back down reversing the flow of the polar vortex. (or multiple pages to that effect  ) I thought the SSW was a 'Wave 2' propagation and so a product of atmospheric waves ( driven by wild MJO movements?) so more a whip crack than a launch into? The past number of weeks have seen extreme movements of the madden Julian oscillation setting up the wave that 'whip cracked'to ther north east of Svalbard effectively splitting the PV and driving the sudden warming? Due to the paucity of launch sites SSW's are nearly unknown in the southern hemisphere will all seeming to be wave 2 formed? If we are seeing increased activity in the MJO then maybe we should expect more SSW's over Antarctica as we move forward? Sea ice has just about returned to the levels it was at last week over the basin so we wasted a weeks worth of growth? Global sea ice levels are again breaking 'lowest measured for the date' over the past week??? That is two years back to back with record low global Sea ice?  The current 2m temps across the high Arctic do not look cold at all? Is Wattsy IMBYing again with the polar plunge over east Canada/far NE USA? Talk about 'Baked Alaska'! |
|
|
|
Post by Ratty on Feb 14, 2018 11:54:19 GMT
|
|
|
|
Post by blustnmtn on Feb 14, 2018 13:44:07 GMT
Seems like an excellent time to make more Eskimos! |
|
|
|
Post by nautonnier on Feb 14, 2018 13:44:14 GMT
Yes - I posted the article. It was showing that SSW were formed by a meridonal jetstream running up over the Himalayas and the Tibetan plateau and the 'orographic' uplift results in the jetstream rising through the low winter troposphere then breaking like a wave in the stratosphere and flowing back down reversing the flow of the polar vortex. (or multiple pages to that effect ) I thought the SSW was a 'Wave 2' propagation and so a product of atmospheric waves ( driven by wild MJO movements?) so more a whip crack than a launch into? The past number of weeks have seen extreme movements of the madden Julian oscillation setting up the wave that 'whip cracked'to ther north east of Svalbard effectively splitting the PV and driving the sudden warming? Due to the paucity of launch sites SSW's are nearly unknown in the southern hemisphere will all seeming to be wave 2 formed? If we are seeing increased activity in the MJO then maybe we should expect more SSW's over Antarctica as we move forward? Sea ice has just about returned to the levels it was at last week over the basin so we wasted a weeks worth of growth? Global sea ice levels are again breaking 'lowest measured for the date' over the past week??? That is two years back to back with record low global Sea ice? The current 2m temps across the high Arctic do not look cold at all? Is Wattsy IMBYing again with the polar plunge over east Canada/far NE USA? Talk about 'Baked Alaska'! You are showing the problem with using anomaly maps to display ideas. The poles look all cosy and red despite being well below freezing meanwhile you will see the blue areas where normally above freezing areas much larger are colder than normal with a considerably increased snow cover. 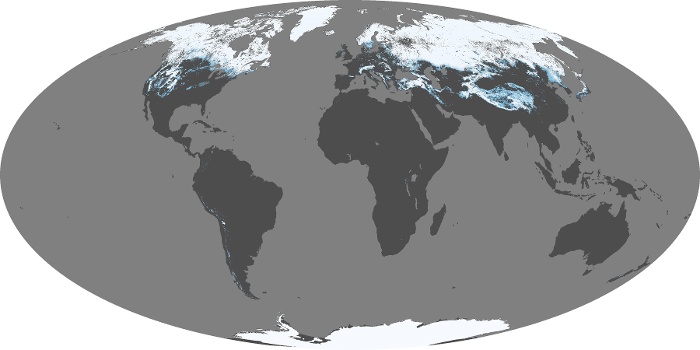 This is rather like including the internal temperature of your freezer in the house average temperature, then raising the freezer thermostat and claiming the house is now warmer as the average temperature has increased. What has actually happened is that the cold Arctic air has been spread out over a larger area. So the pole looks warmer and the temperate areas look colder. |
|
|
|
Post by graywolf on Feb 14, 2018 14:15:51 GMT
The range of temps we used to see across the winter basin used to provide ice cover across both entrances and outside the basin. Across our side ( atlantic) a combination of ancient 'paleocryistic ice' formed and ice bridge ( Odinn) that slowed the ice flowing into the Atlantic. By the 80's this barrier had failed and we lost our basins oldest/most sustainable ice ( over 70% of the old volume). As a result we see the ice retreat from these entrances each summer and now the Beaufort Gyre actively destroys ice rather than grow it?
The diluting of Arctic deep cold by polar plunges and WAA leads to record low freezing degree days beyond 80N.
Today the UK is going from minus2c to plus 20c and this warmth wil push on into europe.
The cold is not shoved back into the basin where it came from it is modified by the WAA and so its power to create ice lost.
It cannot be a good place to be when one summer of high melt/high export will leave the basin ice free ( and unleash normal ocean processes across the basin).
Folk talk about the 'freshening of the ocean surface via melt' yet the storm that caused last weeks losses drove swells that overturned 200m of ocean bring up warmer, saltier waters from the depths. 2 weeks of open water across the basin will allow swells to 'mix out' all of the melt waters in one go ( as we saw with the beaufort freshwater lens after GAC12?) Free mixing of the Arctic ocean will delay refreeze and allow warmth and humidity across the whole basin delaying refreeze even further. What we see in Bering Sea/Barentsz over winter these days will become the norm for the basin through all of autumn and early winter. This will drive alterations/extremes in climate further south and do so over 1 year.
This is the end game for the basin and with this renewed warming spurt in global temps the dilution of the cold we used to expect will continue until we no longer see much ice in the basin at all and ice that forms will often find itself smashed and melted by the next storm/WAA into that region.
If the 'perfect melt storm is tied to low solar then we are already in the 10 to 20 yr return period and heading deeper into solar min. Will we see it this year? Well I do not think we need to? All we need is a 'flying start' into melt season with a low ice max/low thickness and high melt ponding through late April/May. Melt momentum will do the rest as we have seen the last two years where perfect retention weathers still pushed into the lowest 5 years on record ( two of those years being extreme melt years!)
|
|
|
|
Post by missouriboy on Feb 14, 2018 15:15:48 GMT
The range of temps we used to see across the winter basin used to provide ice cover across both entrances and outside the basin. Across our side ( atlantic) a combination of ancient 'paleocryistic ice' formed and ice bridge ( Odinn) that slowed the ice flowing into the Atlantic. By the 80's this barrier had failed and we lost our basins oldest/most sustainable ice ( over 70% of the old volume). As a result we see the ice retreat from these entrances each summer and now the Beaufort Gyre actively destroys ice rather than grow it? The diluting of Arctic deep cold by polar plunges and WAA leads to record low freezing degree days beyond 80N. Today the UK is going from minus2c to plus 20c and this warmth wil push on into europe. The cold is not shoved back into the basin where it came from it is modified by the WAA and so its power to create ice lost. It cannot be a good place to be when one summer of high melt/high export will leave the basin ice free ( and unleash normal ocean processes across the basin). Folk talk about the 'freshening of the ocean surface via melt' yet the storm that caused last weeks losses drove swells that overturned 200m of ocean bring up warmer, saltier waters from the depths. 2 weeks of open water across the basin will allow swells to 'mix out' all of the melt waters in one go ( as we saw with the beaufort freshwater lens after GAC12?) Free mixing of the Arctic ocean will delay refreeze and allow warmth and humidity across the whole basin delaying refreeze even further. What we see in Bering Sea/Barentsz over winter these days will become the norm for the basin through all of autumn and early winter. This will drive alterations/extremes in climate further south and do so over 1 year. This is the end game for the basin and with this renewed warming spurt in global temps the dilution of the cold we used to expect will continue until we no longer see much ice in the basin at all and ice that forms will often find itself smashed and melted by the next storm/WAA into that region. If the 'perfect melt storm is tied to low solar then we are already in the 10 to 20 yr return period and heading deeper into solar min. Will we see it this year? Well I do not think we need to? All we need is a 'flying start' into melt season with a low ice max/low thickness and high melt ponding through late April/May. Melt momentum will do the rest as we have seen the last two years where perfect retention weathers still pushed into the lowest 5 years on record ( two of those years being extreme melt years!) Where is this spurt ... except in areas where no one lives and few/no real time series exist? Actual data please. Selected anomalies one day at a time mean nothing. |
|
|
|
Post by acidohm on Feb 14, 2018 16:21:08 GMT
Yes - I posted the article. It was showing that SSW were formed by a meridonal jetstream running up over the Himalayas and the Tibetan plateau and the 'orographic' uplift results in the jetstream rising through the low winter troposphere then breaking like a wave in the stratosphere and flowing back down reversing the flow of the polar vortex. (or multiple pages to that effect ) I thought the SSW was a 'Wave 2' propagation and so a product of atmospheric waves ( driven by wild MJO movements?) so more a whip crack than a launch into? The past number of weeks have seen extreme movements of the madden Julian oscillation setting up the wave that 'whip cracked'to ther north east of Svalbard effectively splitting the PV and driving the sudden warming? Due to the paucity of launch sites SSW's are nearly unknown in the southern hemisphere will all seeming to be wave 2 formed? If we are seeing increased activity in the MJO then maybe we should expect more SSW's over Antarctica as we move forward? Sea ice has just about returned to the levels it was at last week over the basin so we wasted a weeks worth of growth? Global sea ice levels are again breaking 'lowest measured for the date' over the past week??? That is two years back to back with record low global Sea ice? The current 2m temps across the high Arctic do not look cold at all? Is Wattsy IMBYing again with the polar plunge over east Canada/far NE USA? Talk about 'Baked Alaska'! Graywolf, can you explain to me, or direct me to where I can find an explanation to, wave 2, 3 etc definition?? I.ve seen the term used but no-one ive approached has really offered a simple answer. |
|
|
|
Post by acidohm on Feb 14, 2018 16:22:47 GMT
I thought the SSW was a 'Wave 2' propagation and so a product of atmospheric waves ( driven by wild MJO movements?) so more a whip crack than a launch into? The past number of weeks have seen extreme movements of the madden Julian oscillation setting up the wave that 'whip cracked'to ther north east of Svalbard effectively splitting the PV and driving the sudden warming? Due to the paucity of launch sites SSW's are nearly unknown in the southern hemisphere will all seeming to be wave 2 formed? If we are seeing increased activity in the MJO then maybe we should expect more SSW's over Antarctica as we move forward? Sea ice has just about returned to the levels it was at last week over the basin so we wasted a weeks worth of growth? Global sea ice levels are again breaking 'lowest measured for the date' over the past week??? That is two years back to back with record low global Sea ice? The current 2m temps across the high Arctic do not look cold at all? Is Wattsy IMBYing again with the polar plunge over east Canada/far NE USA? Talk about 'Baked Alaska'! You are showing the problem with using anomaly maps to display ideas. The poles look all cosy and red despite being well below freezing meanwhile you will see the blue areas where normally above freezing areas much larger are colder than normal with a considerably increased snow cover. This is rather like including the internal temperature of your freezer in the house average temperature, then raising the freezer thermostat and claiming the house is now warmer as the average temperature has increased. What has actually happened is that the cold Arctic air has been spread out over a larger area. So the pole looks warmer and the temperate areas look colder. Indeed Naut, and come summer, the temps are likely to be slightly subdued if anything... |
|
|
|
Post by acidohm on Feb 14, 2018 19:41:19 GMT
|
|
|
|
Post by nautonnier on Feb 14, 2018 21:26:26 GMT
Im not sure extra energy is required for larger SSW, in fact, perhaps there's less energy?? The event is afterall a disruption of normal, stabilised conditions, suggesting theyre unstable?? Like a vortexes of spinning water in a glass...loses its structure as it slows down.... I remember there was an article posted here some time back identifying the source area of such air masses as Mongolia? Launch mechanism still unknown? Genghis's revenge. I think that this is the 'article' in question. 
Again, this bubble of warm air rises up to become a thermal wave over South Central Asia on about December 21, 2012 and seems to nearly explode to the north and to the east. The rapidity with which this wave forms, indicates that some very strong dynamical event was forcing warm air up into the stratosphere from the troposphere. It then moves north and east at 10 hPa stratospheric levels and higher.neven1.typepad.com/blog/2013/04/sudden-stratospheric-warmings-causes-effects.htmlSeems to be what's happening here with the smiley Earth  |
|
|
|
Post by Ratty on Feb 14, 2018 23:33:36 GMT
|
|
|
|
Post by sigurdur on Feb 15, 2018 2:44:48 GMT
SSW events are not new.
|
|
|
|
Post by missouriboy on Feb 15, 2018 4:19:18 GMT
Mongolians may have been the first stratospheric visitors.  Think very ugly Mary Poppins. |
|
|
|
Post by graywolf on Feb 16, 2018 13:32:36 GMT
A little thought exercise.
Look at the current SSW. Note its size and duration.
See how widely felt the impacts are.
Now expand that to the whole arctic basin warming the trop above and do that for 2 months ( at least )
How wide would those impacts be felt?
|
|
|
|
Post by mondeoman on Feb 16, 2018 16:26:12 GMT
That’s all that energy buggering off to space...
|
|


 )
) 


 Think very ugly Mary Poppins.