icefisher,
You wrote, "First according to NSIDC the average minimum extent for September 2007 was 4.2 million square miles. "
Not correct.
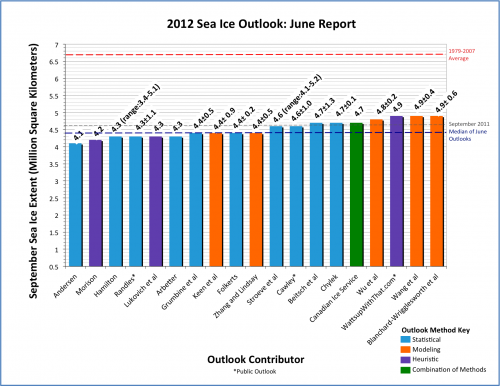
According to NSIDC the average minimum extent for September was 4.28 (which, fyi, is not equal to 4.20). Thus your initial assertion that only one current ARCUS projection is calling for a new minimum is incorrect. Rather, given the statistical margin of error inherent in these projections, 6 of 19, or about 1/3 of the June projections are indicating a new record minimum is possible/likely for this year. First, the ARCUS predictions are to one decimal point. One usually presumes that the error margins are too high to move another decimal point.
That is recognized by error bars that far exceed any differences between 4.2x and 4.28.
In fact those that give error bars indicate that just the opposite of what you claim is more of a possibility than your claim.
. . . .in fact in 17 out 19 studies that rises to the opposite of what you claim, namely its likely a record will not be realized.
You though talk out of the side of your mouth because in fact it is true the ARCUS models can be better represented by saying it is likely/possible a record will not occur with far greater accuracy than claiming its likely/possible a record will occur.
To put it kindly you are using weeny words to spin something 180 degrees.
But that seems to be your usual style. I guess thats what they teach you in underwater basket weaving graduate school.
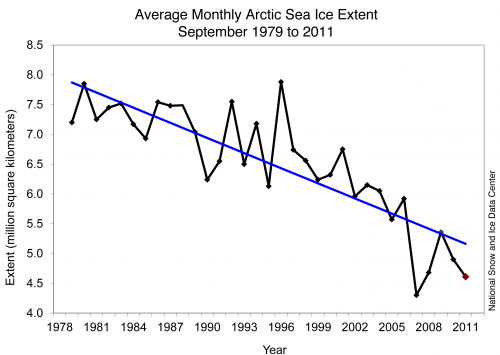
Its also the case there is nothing whatsoever revealing by statistical trend studies except maybe for people who can't read graphs or do any math.
As I said what was of interest was how all the models, 100% of them stand for more ice than the statistical trend models. This clearly suggests that from a "causation" point of view there is wide belief in the science community that forces at play reversing or slowing the historic trend of ice loss.
More specifically to your point above, that "Most appear to be favoring a continuation of the melt rate since about 1995." Following the graph that you posted above, the minimum for 2012 should be greater than 5.0 million sq km. Please note that in the present June ARCUS poll, nobody projected a 2012 result that high.This is incorrect. NSIDC sometime ago stated that ice melt accelerated around 1995. If you align the trend since 1995 the trend points to a level far lower than the majority of the projections. In fact it points to estimate of the most pessimistic statistical model, pretty much by definition, namely 4.1 or lower. You can't statistically get to 4.1 unless there there is some historic trend of some length pointing there. You can only do that heuristically or with a causation model.
The softest statistical model which ignores recent trends in favor of the longer term trends point instead to figures as high as 4.7. So some historic trends support that level as well.
OTOH, the majority of dynamic models (causation models) predict higher levels of ice than the highest statistical model. Obviously there must be a cause for that.
So why is this. Are modelers being politically influenced to come up with projections of slowing of melt? Or is it because they are all working hard to get it right?
I would prefer it to be the latter because if they are being politically pressured and they are responding to it then none of this has a single degree of reliability.
Myself I think ice is a strongly trailing indicator and ice should not be due to turn around for a number of years to come, perhaps another 7 or 12 years.
And if and when it does turn around I have no idea if it will be a complete turn around or just a partial one. But I find it difficult to see how anybody with more than a half dozen braincells could conclude they know the answer to that.
It seems the modelers have more than a few brain cells because there is nothing wrong with trying to model it, they are recognizing politically incorrect stuff in their results (assuming politically correct is that its worse than we thought).
The only real question is whether one is stupid enough to absolutely believe it.
So I was wondering if you had any real light to shed on the topic besides the spin words you seem so fond of. Or if you absolutely believe you know the answer.
(ie. 19/19 ARCUS June projections are calling for a 2012 September monthly average well below the projected average from the graph that you posted above.)One would not expect the average to be exceeded as long as there is a melting trend. Nor for it to be exceeded until some lengthy period of time after a cycle reverses.
It would look like tides. Steep ebbs and floods with lengthy slack water conditions. The only place you don't see that is at choke points where the water may flow rather rapidly at almost all times.
Its actually rather interesting how the doomsday element on this board focuses on choke points like Nares, when such a strait unfreezing would likely extend ice loss even more years beyond an actual climate reversal.
Yet the advocates publish pictures of it in their doomsday scenarios when its perfectly natural that such an event would diminish the timeliness of any global climate signals coming from the Arctic.
I think everybody recognizes there has not been an ice turnaround. I think we have seen some thickening of first year ice since 2007, but older ice continues to be lost.
Since ice loss occurs from drift out of cold seas into warm seas it would tend to mask any signal from increasing ice. What is more interesting is a year round frozen solid Nares Strait and continuing loss of ice like we had years ago. Now that the Nares is not frozen solid the signal has become less reliable as drift from cold seas to warm seas has accelerated and if ice continues to remain on a level trend the only logical conclusion is climate is getting colder in the Arctic because despite more ice loss through Nares, ice loss isn't progressing and has not progressed for 5 years. Its easier to accept such a fact in the presence of zero increase in any mode of ice loss, but when Nares is pumping volume of ice one has to ask why overall ice has not dropped.
You may not be absorbing that but apparently the modelers are.
 Thus, contrary to your assertion that, "Most appear to be favoring a continuation of the melt rate since about 1995." In fact, nobody here agrees with you.
My assertion is true by definition. Popular opinion does not matter.
Science is not a popularity contest.
Statistical trends are the historical trend by definition. The only differences between them is how recent trends are weighted over more distant trends. The trend since 1979 has two distinct trends and shows a strong acceleration post 1995. In order for a statistical trend to steepen from 1979 under those circumstances likely involves providing additional weight to the trend post 1995 or so.
One could safely conclude the differences between the statistical trends is how they do this. Its apparent the lowest projection favor the most likely continuance of the post 1995 trend and the higher statistical projections see more of the recent trend to be natural fluctuation.
What is interesting though is the models are expressing even lesser trends perhaps embracing even more natural variation.
But obviously you don't want to talk about the obvious.