|
|
Post by sigurdur on May 31, 2012 2:21:10 GMT
|
|
|
|
Post by steve on May 31, 2012 6:41:09 GMT
sigurdur,
After a number of years of the temperature trend controversy, and the work of Muller that validates the work of GISS etc. despite using different assumptions about disjointed records, one would have thought these unscientific views that a temperature trend cannot be obtained if you don't have a single site with a continuous record would have long been consigned to the dustbin.
|
|
|
|
Post by sigurdur on May 31, 2012 13:06:33 GMT
Steve:
I understand the trend. However, note the difference between UAH and GISS in that trend for a large area of the world.
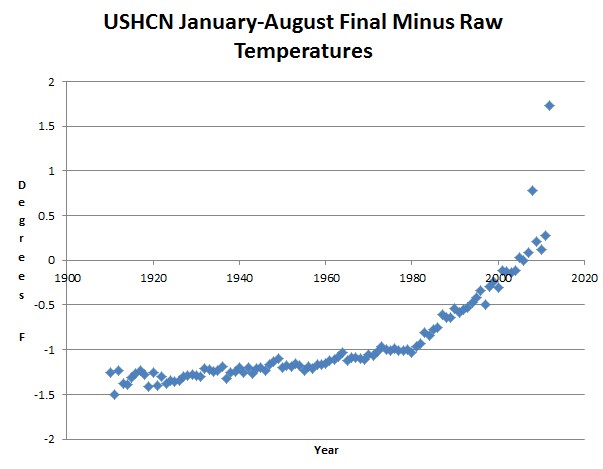
What bothers me is the seemingly continuous manipulation of past termperatures. I think they should be left alone.
There are many others areas of climate science that need to brought up to speed without the distraction of past adjustments.
|
|
|
|
Post by trbixler on May 31, 2012 15:14:11 GMT
Reminds me of YAD06. Find a singular measuring stick and praise its ever increasing accuracy.
|
|
|
|
Post by magellan on Jun 1, 2012 2:48:17 GMT
Someone, maybe steve, explain how replicating results is the same as validation. 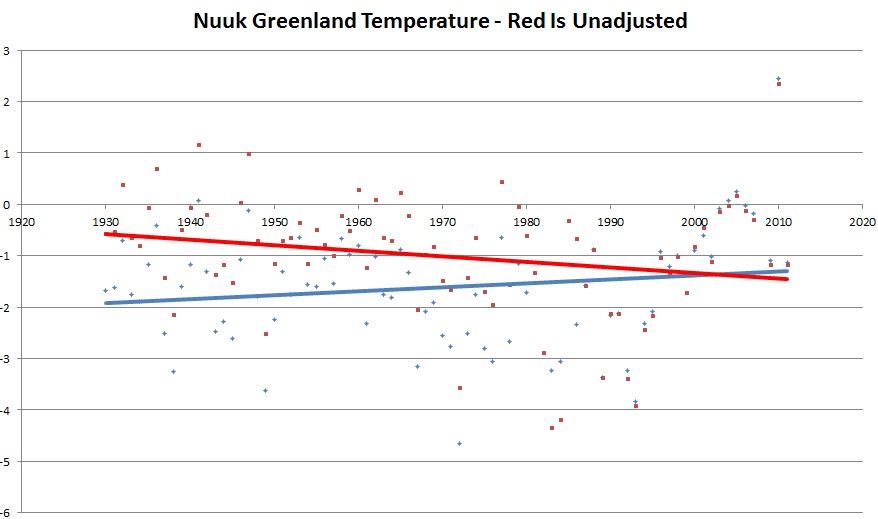  |
|
|
|
Post by steve on Jun 4, 2012 9:35:21 GMT
magellan
After a number of years of the temperature trend controversy, and the work of Muller that validates the work of GISS etc. despite using different assumptions about neighbouring stations, one would have thought these unscientific views that a temperature trend must be wrong if you can pick a few stations that appear to have had their temperature adjusted upwards (and ignore the equal number that have been adjusted downwards).
This thread appears to be in Groundhog Day.
|
|
|
|
Post by trbixler on Jun 4, 2012 14:24:59 GMT
"GHCN v1 vs v3 North America, Region 4" "IMHO the “warming” in North America is entirely an artifact of moving thermometers to airports, swapping to electronic versions that have different thermal issues and different adjustments, Urban Heat Island as we developed more than places like Africa (that has cooled) and perhaps some ‘odd’ data adjustments as the ones here that put more change into the data for the same time and place than the actual ‘warming signal’ we are seeking. We are seeing 1/2 C to 1 C of movement of the average anomaly for a continent based entirely on thermometer selection. With that much variation based on how GHCN Version One is created vs how GHCN Version 3 was crafted: How can you possibly claim that a 1/2 C variation in the anomaly over time within one set is “warming” of anything? It can simply be an artifact of creation of the dataset, just as v1 vs v3 shows artifacts of that size." chiefio.wordpress.com/2012/06/02/ghcn-v1-vs-v-north-america-region-4/ |
|
|
|
Post by sigurdur on Jun 25, 2012 1:39:32 GMT
|
|
|
|
Post by hrizzo on Jun 25, 2012 12:39:47 GMT
trbixler, sigurdur and magellan: You must be re-educated. We live in a new world, with a post-modern science, and as the great Hansen wrote: "Because this result is implausible, instrumentation calibration factors were introduced to reduce the imbalance to the imbalance suggested by climate models, 0.85 W/m2" www.atmos-chem-phys.net/11/13421/2011/acp-11-13421-2011.pdfSo, raw data from reality is wrong and bad, modelically adjusted data is right and good. |
|
|
|
Post by trbixler on Sept 20, 2012 3:40:12 GMT
|
|
|
|
Post by sigurdur on Sept 21, 2012 3:50:20 GMT
Tiz truely amazing.........amazing.......how hot it is......or is it?
|
|
|
|
Post by magellan on Oct 6, 2012 19:27:14 GMT
3/12/2012 solarcycle24com.proboards.com/index.cgi?action=gotopost&board=globalwarming&thread=95&post=79882socold loves UAH these days. When UAH releases v6 to address a warm bias for the past few years he'll accuse UAH of infidelity. 10/5/2012 www.drroyspencer.com/2012/10/uah-v5-5-global-temp-update-for-sept-2012-0-34-deg-c/As discussed in my post from yesterday, the spurious warming in Aqua AMSU channel 5 has resulted in the need for revisions to the UAH global lower tropospheric temperature (LT) product. Let the attacks on Roy Spencer and John Christy resume. We were told years ago RSS was the more accurate product until UAH started diverging from RSS which reported quite a bit cooler temps for the last 2-3+ years, then socold thought UAH was great because it more closely resembled GISS' temperature data inflation algorithm. And remember, the enhanced greenhouse effect "theory" unarguably states the LT will warm faster than the surface because that is where heat is "trapped" resulting in the stratosphere cooling which didn't happen either. Isn't AGW climate science great? This is why I refer to it as Warmology and those that believe it are Warmologists; pseudoscience to the nth degree. |
|
|
|
Post by sigurdur on Oct 7, 2012 18:46:02 GMT
When looking at temp data, one always has to be cognizant of the error bars. There are some who look at the averages, without looking at the error bars, and making broad statements. Upon examination, those statements just do not ring true.
We are in a period of temps very similiar to the MWP right now. That is where one has to go to look and see what the weather will be. The resolution of proxies is not very good, but one can at least get a general direction as to what "may" happen.
Supposedly, the only thing that has changed now verses then is higher CO2. Uh huh.....most of us were not born yesterday.
Hershell found that grain production drops during times of low solar sunspots. This was not just a one time thing, but repeated for each low period.
With that knowledge, we know that if the present trend of low sunspots continues, which it is looking like more and more, we will have disruptions to food/cereal grain production. History is a very valuable teacher is it not?
|
|
|
|
Post by nautonnier on Oct 7, 2012 20:42:32 GMT
Perhaps someone will tell me why Atmospheric Temperature is important - I thought that the AGW hypothesis was based on 'trapping' heat. Atmospheric temperature is not a measure of atmospheric heat content. Averaging the incorrect metric and having heated (sic) arguments on what time of day is being averaged is a completely nugatory exercise. The metric that should be used is the integral of atmospheric energy content in Kilojoules per Kilogram over a 24 hour period. But please don't let me stop the angels on the head of a pin arguments about the incorrect metric.  |
|
|
|
Post by socold on Oct 7, 2012 20:54:38 GMT
You've been very vocal against nontransparent adjustments to raw data in the past. Don't try to paint me as a perp just because you find yourself in a situation where you have to call out Spencer's nontransparent adjustments to raw data and don't want to. On that very thread I pointed out: "You are projecting. You think I would pull a stunt like that because that's exactly what you would do. In fact you've already done it on the last page of this thread with hadcrut4 accusing the upward adjustment of being fraudulent." I am consistent. I don't accuse Phil Jones or James Hansen or Roy Spencer of fraud. They are all doing science. This might also be a time to remind you that Roy Spencer and John Christy still haven't made the UAH adjustment source code available (despite people asking for it). Perhaps you might have some choice words about that too. No, I used UAH because that way you guys didn't have any excuses to dismiss it. If I cited anything else it risked you dismissing it. Citing UAH showed the same thing so why not use that and avoid the hassle? |
|