|
|
Post by fatjohn1408 on Feb 16, 2019 18:04:28 GMT
" New Findings From German Scientists Show Changes in Precipitation Over Europe Linked To Solar Activity
By P Gosselin on 15. February 2019
A significant number of scientists say that the Earth’s climate is in large part impacted by solar activity, and less so by trace gas CO2 concentration. German scientists present new findings showing a link between solar activity and precipitation in Europe.
=================================================
How Changes on the Sun Influences Rain
A balanced level of precipitation provides the basis for a wide range of economic and social activities in Europe. Particularly agriculture, drinking water supply and inland waterway transport are directly affected. However, the amount of rain fluctuates strongly from year to year. While it may pour torrentially in one year, rain may remain absent for weeks in other year. The population is used to this variability and usually knows how to deal with it.
But what is behind the strong changes? A system, or pure atmospheric noise?
The chance discovery by an agricultural scientist from Münster, Germany, now suggests that in certain months that rain over Germany and other parts of Europe follows a pattern that up to now has remained undetected. As part of agricultural consultation, Ludger Laurenz analyzed decades of rainfall records of the weather station in Münster and noticed a constant up and down that followed an 11-year rhythm – especially in February."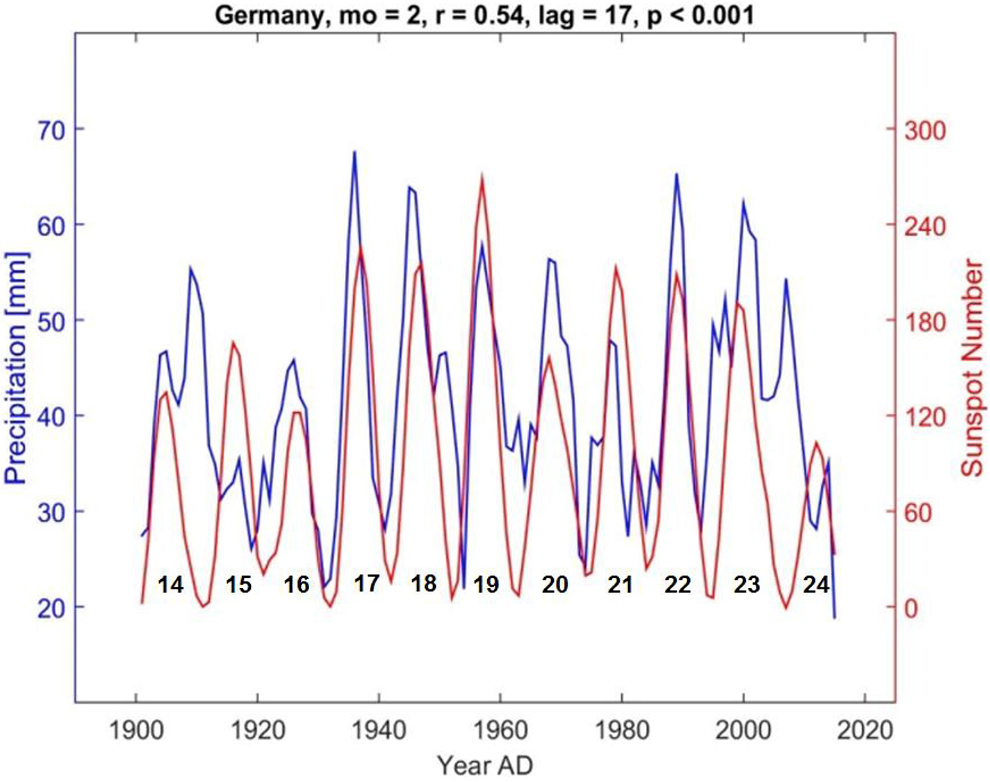 notrickszone.com/2019/02/15/new-findings-from-german-scientists-show-changes-in-precipitation-over-europe-linked-to-solar-activity/ notrickszone.com/2019/02/15/new-findings-from-german-scientists-show-changes-in-precipitation-over-europe-linked-to-solar-activity/This would kind of counteract low sun activity by providing less snow and thus a higher albedo? |
|
|
|
Post by nonentropic on Feb 16, 2019 18:12:37 GMT
any linkage is interesting but the impacts will not all be the same everywhere.
|
|
|
|
Post by missouriboy on Feb 16, 2019 18:20:04 GMT
Perfect timing, Relationship Between the Timing of Large Annual Snowfalls for Columbia, Missouri and Solar CyclesAnd unlike CO2, you don't even need an imagination to see this one.  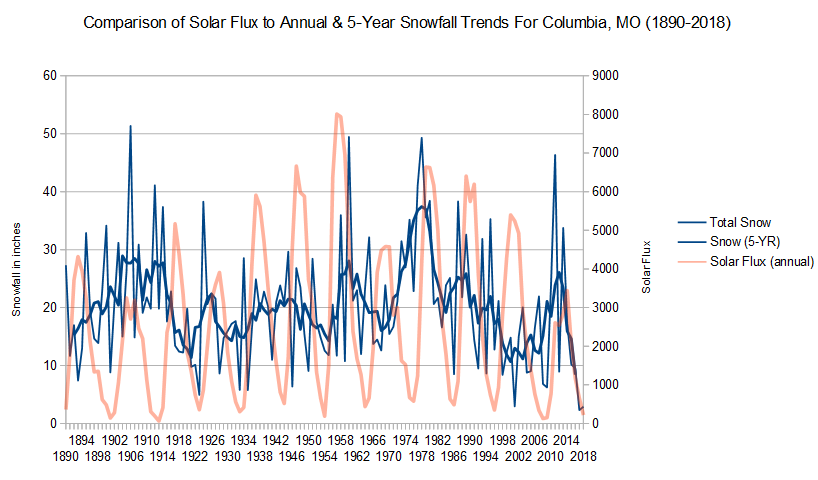 |
|
|
|
Post by nautonnier on Feb 22, 2019 8:10:23 GMT
|
|
|
|
Post by icefisher on Feb 23, 2019 5:10:53 GMT
" New Findings From German Scientists Show Changes in Precipitation Over Europe Linked To Solar Activity
By P Gosselin on 15. February 2019
A significant number of scientists say that the Earth’s climate is in large part impacted by solar activity, and less so by trace gas CO2 concentration. German scientists present new findings showing a link between solar activity and precipitation in Europe.
=================================================
How Changes on the Sun Influences Rain
A balanced level of precipitation provides the basis for a wide range of economic and social activities in Europe. Particularly agriculture, drinking water supply and inland waterway transport are directly affected. However, the amount of rain fluctuates strongly from year to year. While it may pour torrentially in one year, rain may remain absent for weeks in other year. The population is used to this variability and usually knows how to deal with it.
But what is behind the strong changes? A system, or pure atmospheric noise?
The chance discovery by an agricultural scientist from Münster, Germany, now suggests that in certain months that rain over Germany and other parts of Europe follows a pattern that up to now has remained undetected. As part of agricultural consultation, Ludger Laurenz analyzed decades of rainfall records of the weather station in Münster and noticed a constant up and down that followed an 11-year rhythm – especially in February."notrickszone.com/2019/02/15/new-findings-from-german-scientists-show-changes-in-precipitation-over-europe-linked-to-solar-activity/This would kind of counteract low sun activity by providing less snow and thus a higher albedo? except that albedo has nothing directly to do with equilibrium temperature. |
|
|
|
Post by nautonnier on Feb 25, 2019 11:39:39 GMT
|
|
|
|
Post by acidohm on Feb 26, 2019 10:18:57 GMT
Notice where UK is 🙄 the temperature records are breaking, its warmageddin i tell ya!!! Reduce all trace gasses now 😳😳 |
|
|
|
Post by nautonnier on Feb 26, 2019 10:56:06 GMT
|
|
|
|
Post by fatjohn1408 on Feb 26, 2019 12:36:13 GMT
Where does this poster get his data from? This site is the best I found: I dont know how to interpret "estimated international sunspot number" because there seem to have been 12 sunspots on the 13th of february. sidc.be/silso/eisnplotIf anyone would like to help me point to other data source or make sense out of this one it would be appreciated. |
|
|
|
Post by duwayne on Feb 26, 2019 16:09:05 GMT
Fatjohn, when a sunspot appears it is generally a group of small spots which looks like 1 sunspot at low magnification. One way of reporting sunspots which was used in the early days was to report the Group Number which is the simply total of the sunspot "areas" on the sun. With better telescopes, the viewer can see the smaller individual sunspots. The sunspot number is an attempt to reflect the sunspot "power" at any given time. One way to do this is to give each group a value of 10 plus the number of individual sunspots. A sunspot number of 12 would mean there is one sunspot group made up of 2 individual small sunspots. This number sometimes is adjusted upward or downward by a small amount by the experts who believe the number will then better reflect the "power" of the sunspots. www.astroleague.org/content/what%E2%80%99s-sunspot-numberThe source you gave shows both the Group Number and the Sunspot Number but the rules for calculating the sunspot number can vary (power of telescope for example) so the International Sunspot Number has it's own set of rules. |
|
|
|
Post by missouriboy on Feb 26, 2019 21:26:03 GMT
Current Solar Indices Progression for Solar Cycle 24 Compared to SC12 and SC20Note that SC24 continues to look more like SC12 than SC20(1964-76). Geomagnetic activity continues below SC12 and well below SC20. Years on X axis are for SC12. 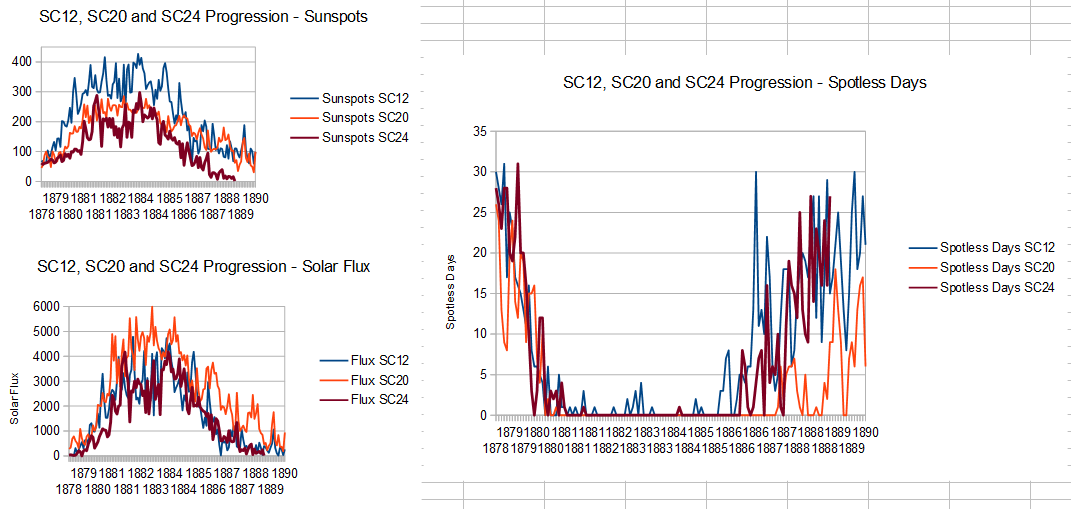 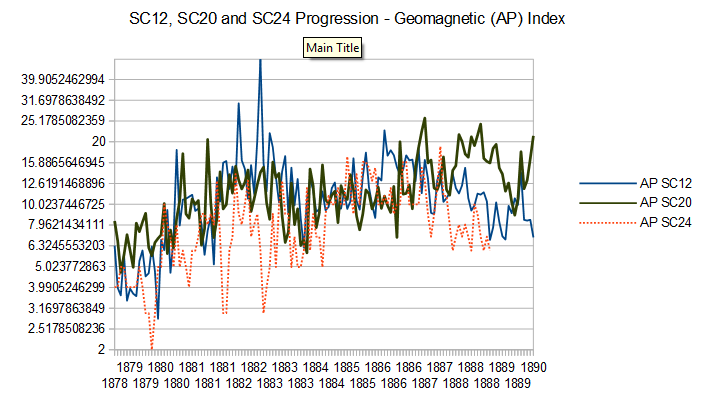
|
|
|
|
Post by acidohm on Feb 27, 2019 19:22:15 GMT
Where does this poster get his data from? This site is the best I found: I dont know how to interpret "estimated international sunspot number" because there seem to have been 12 sunspots on the 13th of february. sidc.be/silso/eisnplotIf anyone would like to help me point to other data source or make sense out of this one it would be appreciated. Occasionally a sunspot (which at a minimum is registered at 11 i think?) may appear, however there must be a timeframe it has to exist to register on the daily total. So if one builds and receeds in 4-5 hours for example, it may not warrant an entry on the daily record. www.swpc.noaa.gov/phenomena/sunspotssolar-cycleI, as many, get running totals from here... www.spaceweather.comAnd graphs from here... www.solen.info/solar/index.html |
|
|
|
Post by missouriboy on Mar 2, 2019 5:37:55 GMT
|
|
|
|
Post by nautonnier on Mar 2, 2019 9:23:24 GMT
So now for Svensmark to be shown right we need to show a similar increase in clouds - do we see that for fourth year? The increase should be slowly climbing out from the noise. |
|
|
|
Post by Ratty on Mar 2, 2019 11:48:30 GMT
So now for Svensmark to be shown right we need to show a similar increase in clouds - do we see that for fourth year? The increase should be slowly climbing out from the noise. Noisy clouds will be proof positive of the GCR connection.  |
|


