|
|
Post by sigurdur on Jun 4, 2014 4:18:55 GMT
(rofl)It will be a low ice area year. I am so confident of this that I voted that way as well......  Sigurdur, I have gone for a modest reduction of last year's minimum. (3.2 against 3.55 in 2013) As flearider points out arctic temperatures are still below normal. Will 2013 be repeated? What makes you so confident of your low ice area this year? (2.5 against 2.33 in 2012) Niel: To tired tonight to explain but I will soon. |
|
|
|
Post by cuttydyer on Jun 4, 2014 8:02:01 GMT
Hi Code, I'm extremely skeptical that CO2 is the primary driver for the relatively recent rise in temps. In terms of climate change, 1880 to present is not a long term trend. Here's a graph showing Antarctica's long term trend:  Link: www.bbc.co.uk/news/science-environment-27110880Here's a video of Jørgen Peder Steffensen (Associate Professor at the University of Copenhagen and one of the world’s leading experts on ice cores). Using ice cores from sites in Greenland, he has been able to reconstruct temperatures there for the last 10000 years. Link: vimeo.com/14366077 In the video he points out that we started to observe meteorology at a very cold point in time (the end of the Little Ice Age):  Jørgen's graph shows Greenland's Medieval and Roman warm periods were far warmer than today; his pen points to the very cold period when meteorology started. |
|
|
|
Post by kenfeldman on Jun 4, 2014 16:10:19 GMT
Hi Code, I'm extremely skeptical that CO2 is the primary driver for the relatively recent rise in temps. In terms of climate change, 1880 to present is not a long term trend. Here's a graph showing Antarctica's long term trend: Link: www.bbc.co.uk/news/science-environment-27110880Cutty, The "present" in an ice core is about 50 years before the core was drilled, as it takes that long for the snow that has fallen in the intervening years to be compacted into ice. So that part of the Antarctic ice core labeled "CO2 Portion..." is from before 1960 when the levels were around 315 ppm. We are now up to 400 ppm and rising. Since those most recent layers of the ice cores were laid down, temperatures have been steadily increasing. They started ramping up in the 70s, the 80s were warmer than the 70s, the 90s warmer still and the 00's the warmest decade in the observational record. (My avatar is a graphic display of those facts). Code, The webpage linked to in the Chasing Ice trailer seems to be an accurate, if simple, summary of global warming. What grade are the kids in? Some of the science behind the enhanced greenhouse effect can be difficult to understand if you don't have at least high school physics. You need calculus to do the radiative transfer equations to show that a doubling of CO2 concentration leads to a 1.2k increase in temperature, and then the feedback effects of enhance water vapor from the higher temps require high school chemistry. |
|
|
|
Post by icefisher on Jun 4, 2014 16:55:55 GMT
Cutty, The "present" in an ice core is about 50 years before the core was drilled, as it takes that long for the snow that has fallen in the intervening years to be compacted into ice. So that part of the Antarctic ice core labeled "CO2 Portion..." is from before 1960 when the levels were around 315 ppm. We are now up to 400 ppm and rising. Since those most recent layers of the ice cores were laid down, temperatures have been steadily increasing. They started ramping up in the 70s, the 80s were warmer than the 70s, the 90s warmer still and the 00's the warmest decade in the observational record. (My avatar is a graphic display of those facts). Code, The webpage linked to in the Chasing Ice trailer seems to be an accurate, if simple, summary of global warming. What grade are the kids in? Some of the science behind the enhanced greenhouse effect can be difficult to understand if you don't have at least high school physics. You need calculus to do the radiative transfer equations to show that a doubling of CO2 concentration leads to a 1.2k increase in temperature, and then the feedback effects of enhance water vapor from the higher temps require high school chemistry. Ken you are completely off topic here. The discussion is about Antarctic temperatures not global temperatures. Warming commenced in the 1970's globally but not until 1979. Global temperatures were as flat as a pancake from 1970 thru 1978. But for the South Pole UAH satellite temperature data since 1979 shows a 0.0/decade temperature trend. So there has been no warming there. Antarctic has remained flat as a pancake while "regional" variability elsewhere has been the reason for the "global" warming since 1979. Here is a high resolution image of the ice core record that positions temperatures for 2010 when CO2 was 388ppm. As you can seen modern warming does not amount to a hill of beans.  Modern warming in the antarctic is next to meaningless in terms of natural variability. And the "global" variability you are emphasizing in your off topic response above (1/2 a degree centigrade since 1979 per Hadcrut3) is well within the range of natural variability seen in the Antarctic for the past 10,000 years. |
|
|
|
Post by cuttydyer on Jun 4, 2014 17:19:23 GMT
|
|
|
|
Post by duwayne on Jun 4, 2014 18:34:03 GMT
Code, I believe in AGW and I am skeptical of the climate models. Specifically, I believe the earth will warm by about 0.5C between now and the end of this century and a portion of the increase will be due to CO2. I don’t know whether that meets your criteria for replying to your question but I’ve done so in hopes that it does. From the website info I am guessing that you might be located in central Ohio, so my references below are to Columbus. But they are applicable to other locations as well. The Chasing Ice website focuses on a very, very narrow portion of the climate and then somehow claims this covers the subject to the point that someone is now capable of advising their congressman on the intricacies of climate science. If this were my child, I’d like to see him exposed to the broader aspects of climate science such as: 1. In times past, ice covered the area from Columbus, Ohio to the north pole making it unfit for farming or living. What is the right amount of ice cover? 2. The antarctic sea ice is growing at about the same rate as arctic sea ice is receding. Can this be caused by global warming in both cases? 3. The global temperature increased by about 0.9C from 1850 to 2014. The annual average temperature difference between a town 15 miles north of Columbus and one 15 miles south is also about 0.9C. Which town has the better temperature? Is this difference really significant? How does this compare to the high and low temperature for Columbus on any given day? Or the differences from season to season? 4. How much of the 0.9C temperature increase could be due to carbon dioxide (CO2) when CO2 emissions didn’t start to increase significantly until the 1940’s and temperatures have been flat for the last 15 years while CO2 emissions have continued to increase? 5. Extreme weather events have occurred throughout history. Is it worth noting that the frequency of the extreme events is not increasing?  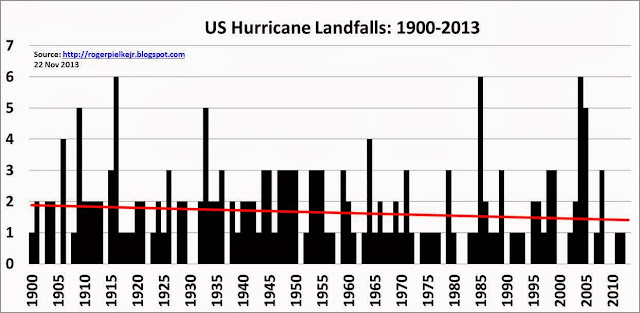  6. Why have the climate scientists grossly over-estimated the rate of global warming? 7. Am I in position to advise my congressman until I can answer these questions and others? 8. Does my school focus me on only a very, very small part of the climate question and pretend that I am educated? |
|
|
|
Post by nonentropic on Jun 4, 2014 21:27:53 GMT
that about says it all and funnily enough no emotion no fear just simple sane questions.
Duwayne
|
|
|
|
Post by Ratty on Jun 6, 2014 7:45:27 GMT
|
|
|
|
Post by duwayne on Jun 6, 2014 15:06:34 GMT
The websites you provided refer to Ohio’s District 12, so I thought you might live there. The questions I asked, however, apply world-wide. The Chasing Ice story in no way provides a schoolchild with a meaningful perspective on global warming. In fact, it is very misleading if this is the only information provided or if the importance of this vignette is over-emphasized. The idea that you show a student a dramatization of a very, very small segment of the environment and then propose, as the website does, that they use this new found information to advise their congressman on the broad subject of climate science is actually quite appalling. I’ll be interested to hear what actions you take, if any. |
|
|
|
Post by Ratty on Jun 7, 2014 1:47:47 GMT
Duwanye and Ratty: There seems to be some confusion about where I live?? I live in Western, WA USA. I live in the Seattle Metro area. Looks like a nice part of the world. WA here in Oz is Western Australia. |
|
|
|
Post by Ratty on Jun 7, 2014 7:39:30 GMT
"Two roads diverged in a yellow wood .... " Robert Frost
|
|
|
|
Post by cuttydyer on Jun 11, 2014 6:46:29 GMT
Is the Arctic heading for a below average cold Summer?  Ice extent currently within 1 standard deviation.  |
|
|
|
Post by neilhamp on Jun 11, 2014 6:53:06 GMT
Thanks very much cuttydyer
I was just about to make the same comment myself regarding the arctic temperatures
You have done a much better job than me!
I have checked through every temperature chart. This current chart seems very unusual.
|
|
|
|
Post by douglavers on Jun 11, 2014 9:45:15 GMT
Perhaps the weakness of the North Atlantic Drift is finally showing up in anomalously low Arctic temperatures.
As cuttydyer indirectly pointed out, a possible significant depression in Arctic temperatures will drastically diminish the period above freezing.i.e much less melting?
|
|
|
|
Post by flearider on Jun 12, 2014 22:36:29 GMT
maybe it's cause the sun is growing colder and all the new ice is reflecting it away ..
|
|


