|
|
Post by icefisher on May 7, 2014 20:35:41 GMT
Thanks Ken thats very helpful. Its hard to compare what Bastardi is doing with the NOAA data and Pettit's chart of the "cryosphere" data, it appears that CFS uses "1999-2010 hindcast climatology" as "normal". So applying CFS projected anomalies to Cryosphere data, it seems likely CFS would now pick a minimum of 3.8mmsqkm because it appears using Pettit's chart the 1999-2010 average Arctic sea ice would be about 3.8mmsqkm. The latest CFS prediction has increased the positive anomaly, above that posted last week by Bastardi. Now the minimum appears to occur almost exactly at the average of the CFS 12 year hindcast. Here is the latest CFS chart. (obviously difficult to compare to Cryosphere since the CFS average extent is about 6.3mmsqkm and our equivalent Crysophere average minimum extent for the same period is 3.8mmsqkm). With Jaxa somewhere midway between the two, its going to be pretty difficult to pinpoint when we have an ice free Arctic summer at 1.0mmsqkm, assuming we ever get close to that. Myself I am sticking with the exit of the last berg of ice from the Arctic as zero summer seaice in the arctic!   I predict that won't occur for at least 50 thousand years! 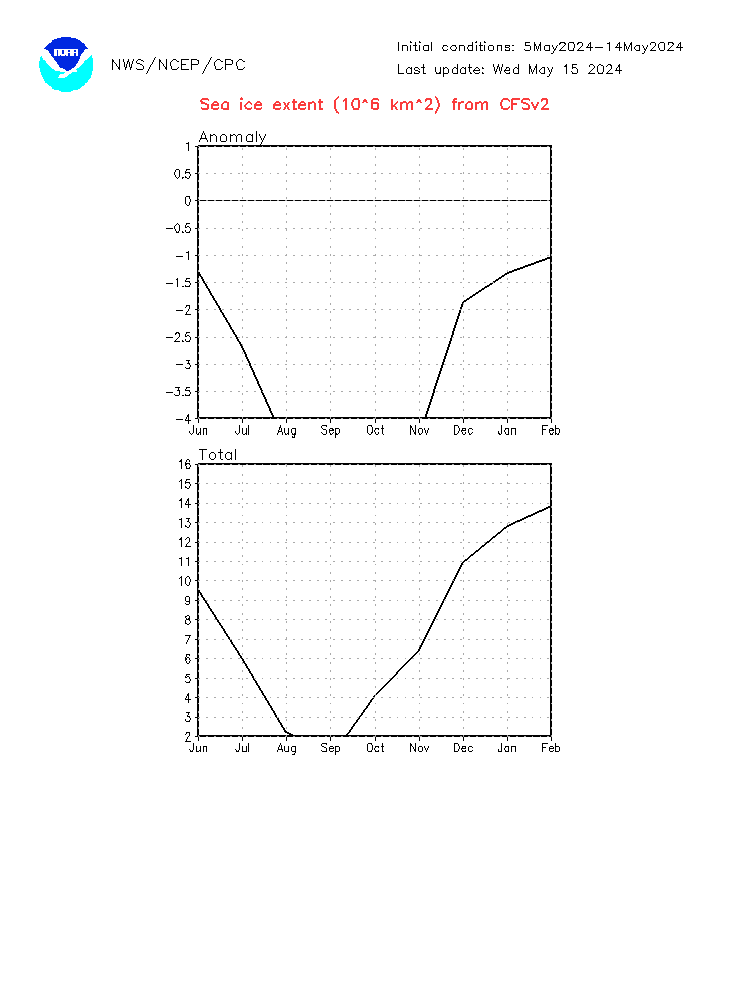 |
|
|
|
Post by sigurdur on May 7, 2014 22:07:39 GMT
nsidc.org/arcticseaicenews/Spring unloaded May 7, 2014 Since reaching its annual maximum extent on March 21, Arctic sea ice extent has declined somewhat unevenly, but has consistently been well below its average 1981 to 2010 extent. While the rate of Arctic-wide retreat was rapid through the first half of April, it has subsequently slowed down. However, ice breakup was quite early in the Bering Sea, presenting difficulties for gold dredging operations and seal hunters in the region. In the Antarctic, sea ice continued to reach record high extents.
|
|
|
|
Post by icefisher on May 7, 2014 23:38:56 GMT
nsidc.org/arcticseaicenews/Spring unloaded May 7, 2014 Since reaching its annual maximum extent on March 21, Arctic sea ice extent has declined somewhat unevenly, but has consistently been well below its average 1981 to 2010 extent. While the rate of Arctic-wide retreat was rapid through the first half of April, it has subsequently slowed down. However, ice breakup was quite early in the Bering Sea, presenting difficulties for gold dredging operations and seal hunters in the region. In the Antarctic, sea ice continued to reach record high extents. Thats consistent with cfs v2 projections. They have May more than 600ksqkm below the 1999-2010 average (it would be much more below the 1981 to 2010 average). They project an increasing anomaly till June as apparently very thin first year ice melts off, after which ice melt slows and the direction of the anomaly changes. That is probably reflecting the massive amount of 2nd year ice which according to various sources increased by between 1.3millionsqkm and 1.6millionsqkm last year. When combined with the projection of low physical transport out of the Arctic that provides a potential physical basis for a second year increase in minimum despite a bad ice winter. |
|
|
|
Post by kenfeldman on May 8, 2014 3:24:18 GMT
Thanks Ken thats very helpful. Its hard to compare what Bastardi is doing with the NOAA data and Pettit's chart of the "cryosphere" data, it appears that CFS uses "1999-2010 hindcast climatology" as "normal". So applying CFS projected anomalies to Cryosphere data, it seems likely CFS would now pick a minimum of 3.8mmsqkm because it appears using Pettit's chart the 1999-2010 average Arctic sea ice would be about 3.8mmsqkm. The latest CFS prediction has increased the positive anomaly, above that posted last week by Bastardi. Now the minimum appears to occur almost exactly at the average of the CFS 12 year hindcast. Here is the latest CFS chart. (obviously difficult to compare to Cryosphere since the CFS average extent is about 6.3mmsqkm and our equivalent Crysophere average minimum extent for the same period is 3.8mmsqkm). With Jaxa somewhere midway between the two, its going to be pretty difficult to pinpoint when we have an ice free Arctic summer at 1.0mmsqkm, assuming we ever get close to that. Myself I am sticking with the exit of the last berg of ice from the Arctic as zero summer seaice in the arctic! I predict that won't occur for at least 50 thousand years! Keep in mind that JB is using a model to make his prediction, and the sea ice models have not been very good. Here's an image comparing model runs to observations:  |
|
|
|
Post by icefisher on May 8, 2014 4:43:12 GMT
Ken, models have been atrocious at the longterm trends clearly.
One could argue that the only thing missing in the long term models is a natural 60 to 70 year cycle (72 years per Astromet) but the lack of that probably has nothing to do with a first time ever prediction of ice exceeding normal by the CFS system which is a short term model forecasting out only 9 months. The CFS model may not even have a long term climate variable in their model (CO2 increases or 60 to 70 year variations).
Here is a quote from a paper on CFS regarding its skill:
Evaluation of the reforecasts show that the CFSv2 increases the length of skillful MJO forecasts from 6 to 17 days (dramatically improving subseasonal forecasts), nearly doubles the skill of seasonal forecasts of 2-m temperatures over the United States, and significantly improves global SST forecasts over its predecessor.
I have not seen anything else relevant to the skill of CFS models other than the fact they tend to stumble on the ENSO spring predictability barrier for their ENSO forecasts.
|
|
|
|
Post by cuttydyer on May 9, 2014 15:13:44 GMT
If you wish to enter the "competition" please copy these instructions.
Add your forecast to the list below (highest forecast at the top)
Then repost the list
HRizzo 4.8
zaphod 4.3
throttlup 4.2
phydeaux 4.1
dontgetoutmuch 4.0
icefisher 3.9
Cutty Dyer 3.8
(2013 - 3.55)
flearider 3.3
neilhamp 3.3
karlox 3.1
kenfeldman 2.7
sigurdur 2.5
(2012 - 2.33)
birder 2.2
Al Gore 0.0 (In his 2007 Nobel Prize acceptance speech, Al Gore predicted that the Arctic will be ice free in the summer of 2014)
|
|
|
|
Post by sigurdur on May 9, 2014 15:22:24 GMT
Mr. Gore is a looser, heck, even in this poll he can't get it correct.
|
|
|
|
Post by sigurdur on May 14, 2014 12:06:27 GMT
|
|
|
|
Post by neilhamp on May 31, 2014 10:43:44 GMT
|
|
|
|
Post by kenfeldman on Jun 2, 2014 23:23:03 GMT
This is wrong. Here is what Mr. Gore said: And he got that wrong. Here is what the study he referred to said: I'm not sure what "near ice free" means, but you at least have to wait until October of 2016 before you can say he's wrong.  |
|
|
|
Post by kenfeldman on Jun 2, 2014 23:27:58 GMT
It's the beginning of the real melt season (June through August), and things don't look so good for the Arctic sea ice:  It looks like the Russian side of the Arctic is melting out early this year. There's already a big ice-free area in the Chuckai Sea and the Northwest Passage is also thinning out quickly. It should be an interesting year. |
|
|
|
Post by sigurdur on Jun 3, 2014 1:50:02 GMT
(rofl)It will be a low ice area year. I am so confident of this that I voted that way as well......  |
|
|
|
Post by flearider on Jun 3, 2014 9:01:59 GMT
I'd go as far to say if current temps stay like they are ocean.dmi.dk/arctic/meant80n.uk.php it may not be all that bad ... the thing is will it be a short melt season ? and with not a lot of heat in the nh oceans theres not a lot to drive the melt .. |
|
|
|
Post by neilhamp on Jun 3, 2014 9:45:32 GMT
(rofl)It will be a low ice area year. I am so confident of this that I voted that way as well...... Sigurdur, I have gone for a modest reduction of last year's minimum. (3.2 against 3.55 in 2013) As flearider points out arctic temperatures are still below normal. Will 2013 be repeated? What makes you so confident of your low ice area this year? (2.5 against 2.33 in 2012) |
|
|
|
Post by kenfeldman on Jun 3, 2014 15:39:57 GMT
My prediction isn't as low as Sig's (I'm at 2.7), however, I'll explain why I think the ice area will be closer to 2012 than 2013. While the temperatures above 80N have been colder than average the past month, they are now close to the freezing temperature of salt water (271k). And since what is reported is an average temperature, there are probably areas above 271k now, allowing melt to begin. That would explain the weak areas in the Uni-Bremmen map I posted above.
Meanwhile, the temperatures along the Russian coast have been very warm the past week, from 15c to 20c in some areas. The ice around the Russian coast has been melting.
Clear skies and warmer temperatures are predicted for the this week over the Canadian side of the Arctic, so melting should begin to increase on that side too. It's interesting that the Northwest Passage is already clearing out, it seems to be happening early, even though surface temperatures were pretty cold over that part of the Arctic.
Perhaps the ocean temperatures are warmer than normal. A lot of the melt occurs from the underside of the ice, so if warmer water has flowed into the Arctic, it could make a big difference in the melt.
|
|


 I predict that won't occur for at least 50 thousand years!


