|
|
Post by nautonnier on Oct 1, 2017 23:03:14 GMT
The difficult part of course is not observing where cloud _is_ but in forecasting where it will be and what level and what albedo. High cirrus is totally different to convective storms and they are different to low stratus.
|
|
|
|
Post by Ratty on Oct 1, 2017 23:59:19 GMT
The difficult part of course is not observing where cloud _is_ but in forecasting where it will be and what level and what albedo. High cirrus is totally different to convective storms and they are different to low stratus. Occasionally, I will take a picture of clouds, more complex than this:  and think "model that" .....  |
|
|
|
Post by missouriboy on Oct 2, 2017 0:08:59 GMT
I found this but it is limited to ‘71-‘96. It certainly seems that cloud cover by region and type is closely studied. journals.ametsoc.org/doi/full/10.1175/JCLI4031.1my quick skim notes that they find total cloud cover decreasing for 71-96. That makes sense. There was a whole thread on this site dedicated to this topic some time back. I remember posting some graphs comparing SST changes to cloud cover changes for 15N to 15S latitude. |
|
|
|
Post by icefisher on Oct 2, 2017 0:16:01 GMT
I found this but it is limited to ‘71-‘96. It certainly seems that cloud cover by region and type is closely studied. journals.ametsoc.org/doi/full/10.1175/JCLI4031.1my quick skim notes that they find total cloud cover decreasing for 71-96. That makes sense. If I am not mistaken the popular theory is decreasing cloud cover is expected with increasing CO2 as it is widely associated with decreased precipitation and more water vapor in the air. I have always had a big problem with that part of the theory, but they need it because they know more thicker clouds make it cooler and less makes it warmer. They even have it theorized that high cirrus clouds may make it warmer as clouds become thinner and the greenhouse effect takes over with a lot of water vapor in the atmosphere. That part may make sense, the part that doesn't make sense to me is why more water vapor would not just compute to more clouds. Thats all stuff to be explained. |
|
|
|
Post by blustnmtn on Oct 2, 2017 0:17:48 GMT
I found this but it is limited to ‘71-‘96. It certainly seems that cloud cover by region and type is closely studied. journals.ametsoc.org/doi/full/10.1175/JCLI4031.1my quick skim notes that they find total cloud cover decreasing for 71-96. That makes sense. There was a whole thread on this site dedicated to this topic some time back. I remember posting some graphs comparing SST changes to cloud cover changes for 15N to 15S latitude. I figured that was the case. I was thinking about increased cosmic rays due to weak cycle 24 increasing cloud formation and the resultant impact on La Niña recharge of Pacific Ocean heat. Seems like a unique time in recent history (unprecedented). 😎 |
|
|
|
Post by blustnmtn on Oct 2, 2017 0:28:27 GMT
I found this but it is limited to ‘71-‘96. It certainly seems that cloud cover by region and type is closely studied. journals.ametsoc.org/doi/full/10.1175/JCLI4031.1my quick skim notes that they find total cloud cover decreasing for 71-96. That makes sense. If I am not mistaken the popular theory is decreasing cloud cover is expected with increasing CO2. I know that CO2 is the most powerful gas in the universe but I didn’t know that one icefisher! I said “makes sense” based on the small increase in temps during the 80s and 90s that could correlate with high sunspot numbers and lower cosmic ray seeding of clouds. I’m very interested on how this is all going to play out. |
|
|
|
Post by missouriboy on Oct 2, 2017 0:34:06 GMT
If they had actually plotted the strengths of El Ninos and La Ninas, they could easily see that the truely strong La Ninas do not appear to be correlated with the truely strong El Ninos. They appear to be more associated with colder periods in world temperatures. Maybe this is just another attempt to keep the 'gravy train' on track for another few years. Hot will give you both hot and cold. Thus, if we do have a strong, cold La Nina (or equivalent), it too is related to CO2. 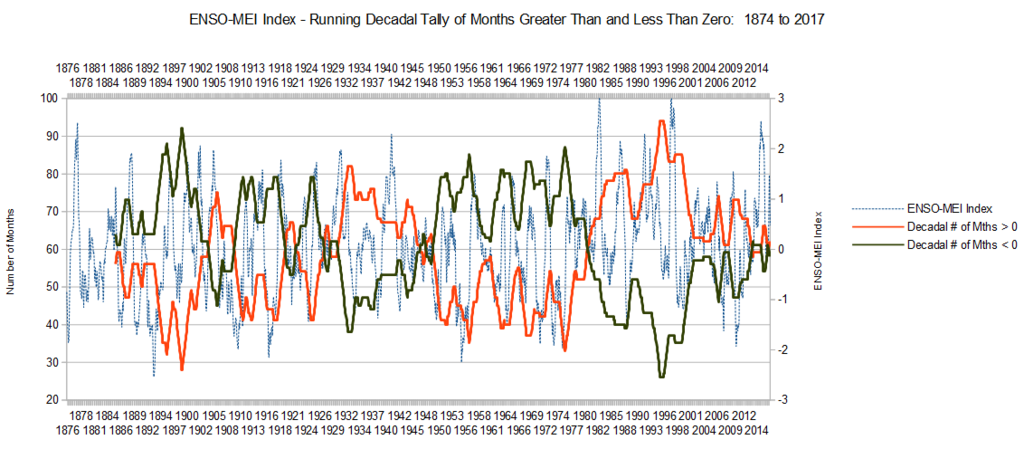 |
|
|
|
Post by icefisher on Oct 2, 2017 0:35:14 GMT
There was a whole thread on this site dedicated to this topic some time back. I remember posting some graphs comparing SST changes to cloud cover changes for 15N to 15S latitude. I figured that was the case. I was thinking about increased cosmic rays due to weak cycle 24 increasing cloud formation and the resultant impact on La Niña recharge of Pacific Ocean heat. Seems like a unique time in recent history (unprecedented). 😎 Svensmark's theory has been a thorn in the side of warmist philosophy. Thus from the day it was published there has been back and forth on it. It got enough traction in the world science community to spend quite a few million dollars (16 nations participating) to come up with an experiment, which confirmed a connection. Since then the argument has been about the strength of the connection. . . .something we really know nothing about. But I would argue we also don't know anything at all about the net strength of the greenhouse physical connection or whether the greenhouse effect is canceled out by the fact the same effect also serves to cool an atmosphere that would not cool if no greenhouse gases were present. There is enough uncertainty surrounding all these theories including the Svensmark theory to make a choice of one more of a religious choice than a scientific choice. |
|


