|
|
Post by kenfeldman on May 26, 2009 22:31:51 GMT
GLC writes: "It occurs to me that if we don't know what caused the warming then how can we be sure what caused the warming since 1975. We need to do a bit of 'detection and attribution' here." Perhaps you would like to detect and attribute whatever may have forced the warming during the Holocene Optimum? Just wondering what might have caused the substantial cooling since then. I answered this in a couple of other threads, but basically it's the natural forcings that are very well modelled in the GCMs. For the Holocene Climate optimum, it was the orbital forcings (Milankovich cycles) that changed the amount of solar insolation in the Northern Hemisphere summer, melting the North American ice sheet over thousands of years. We are now in the cooling phase of the orbital cycles, which should lead to a new ice age in 10 to 20 thousand years. Yet instead, we've had 0.7 degrees of warming in the last century, with another 2 to 5 degrees expected this century. |
|
wylie
Level 3 Rank

Posts: 129
|
Post by wylie on May 26, 2009 22:40:35 GMT
Ken,
The last (Eemian) interglacial lasted only about 13,000-15,000 years. The current Holocene interglacial is already about 12-13,000 years old. I don't think we have 10,000-20,000 years till the next ice-age. Personally, I would rather live in an interglacial world than an ice-age world. Also, peak oil seems to have occurred last year and peak coal is not very far away (the US has already reached peak coal in terms of BTUs produced and is likely within 15 years of peak coal in terms of tonnage). I don't think we have near enough ECONOMICALLY RECOVERABLE hydrocarbons to keep increasing the CO2 concentration in the atmosphere.
It may very well be that the bigger worry is a cooling climate (at least in terms of human population).
IWylie
|
|
|
|
Post by kenfeldman on May 26, 2009 23:51:51 GMT
Ken, The last (Eemian) interglacial lasted only about 13,000-15,000 years. The current Holocene interglacial is already about 12-13,000 years old. I don't think we have 10,000-20,000 years till the next ice-age. Personally, I would rather live in an interglacial world than an ice-age world. Also, peak oil seems to have occurred last year and peak coal is not very far away (the US has already reached peak coal in terms of BTUs produced and is likely within 15 years of peak coal in terms of tonnage). I don't think we have near enough ECONOMICALLY RECOVERABLE hydrocarbons to keep increasing the CO2 concentration in the atmosphere. It may very well be that the bigger worry is a cooling climate (at least in terms of human population). IWylie Wylie, The length of the interglacial is controlled primarily by the orbital forcings. Most of the past interglacials have been around 10,000 years, as you noted, but some have been as long as 50,000 years. The current interglacial is already 10,000 years long and was estimated to have another 10,000 to 20,000 years to run before the next ice age (a total length of 30,000 years). However, recent studies have speculated that the increase in greenhouse gases has pushed it off by at least another 10,000 years due to the fact that the northern hemisphere ice sheets are not growing (in fact, most glaciers and the Arctic sea ice is shrinking and may disappear entirely within a few decades). Note that human beings, our domesticated animals and crops all evolved over the period in which ice ages were present. Many deniers will point out that the Little Ice Age ran from about 1400 to 1850. While there were some setbacks during this time (the Black Plague and a series of endless wars in Europe), for the most part, human populations expanded and our technologies increased, paving the way for the boom of the 20th century (which has lead to the problems we'll be living with for the next few centuries). As for peak oil, that just means that 50% of the recoverable resources have been used. Many people would argue that we have a decade or two to go before the oil resources peak. And if they do, that makes projects like the tar sands and oil shales in Canada, the US mountain states and Venezuela economically viable, as the oil from those projects will fetch high enough prices to pay for the higher costs of delivering them. The carbon emissions from the tar sands and oil shales are much higher than the carbon emissions from the liquid petroleum resources we're currently using. |
|
|
|
Post by tacoman25 on May 27, 2009 2:50:11 GMT
There has been no global warming this millenium. Perhaps you should keep up with the times? Every year in the 21st century has been warmer than every year in the 19th and 20th centuries with the exception of 1998. Perhaps you should investigate the facts before you just repeat denialist myths. Enough with the insulting remarks. I have done plenty of investigating for myself, thank you, I'm not repeating anything. It is not a myth, it is fact: ACCORDING TO GLOBAL TEMPERATURE TRENDS, THERE HAS BEEN NO WARMING FOR 10 YEARS. You may insist this is an insignificant time period, but if you say the globe is currently warming, you are the one in denial and unable to accept the facts. |
|
|
|
Post by tacoman25 on May 27, 2009 2:53:44 GMT
Every year in the 21st century has been warmer than every year in the 19th and 20th centuries with the exception of 1998.
Perhaps you should investigate the facts before you just repeat denialist myths. To be fair your statement and Tacoman25's "no 21st century warming" statement could both be true. In fact they both probably are, though Tacoman might need to define when the start of the 21st century occurred. There was no year 0, so the 21st century started on January 1, 2001.  Take a look at that graph. Every point from 2001 to 2008 is higher than every other year on the graph with the exception of 1998. This is what the denialists mean by "no global warming"? I find it interesting that on this website, which is devoted to solar cycle 24, people forget that we are currently in a solar minimum, which which started in 2006 with the first spotless day since the last minimum. 2008 saw very little solar activity and a pretty deep La Nina, which should indicate cooling. Compare the temps for 1996, the minimum between SCs 22 and 23, with 2008, our current minimum: 1996 Anamoly 0.29 C 2008 Anamoly 0.44 C So 2008 is 0.15 C warmer than the year of the previous solar minimum, even though there was a La Nina event in 2008. While looking at La Nina years, we had a pretty deep La Nina in 1999 and 2000. Let's look at the global temperature anamolies: 1999 Anamoly 0.32 C 2000 Anamoly 0.33 C 2008 Anamoly 0.44 C So coming off the huge El Nino of 1997-98 (1998 anamoly 0.57) the globe cooled for two years and then the warming took off. Anamolies in 2002 through 2007 were all above 0.50, which is more than 0.1 degrees C higher than any other year than 1998. 2005 was the warmest year on record, with an anomoly of 0.62 C, 0.05 C higher than 1998. That's the record of "no warming" the denialists want you to believe. Don't be deceived. Did anyone ever say there has been no warming since 1996? NO. And your comparison of the 1999-2000 La Nina to the 2007-08 La Nina is invalid. The 1999-00 one lasted much longer and peaked stronger. For the six months of its peak, the 2007-08 La Nina actually resulted in cooler tropospheric temps than the 1999-00 six month peak. Your citation of 2005 as the "warmest year on record" is also invalid. Of the four major global temp sources, only GISS had 2005 warmer than 1998...the other three did not have 2005 even close to 1998. Therefore, GISS is the obvious outlier here. Stop cherry-picking the one temp source that fits your agenda. |
|
|
|
Post by donmartin on May 27, 2009 3:49:04 GMT
One must be careful when determining the period of an interglacial. I do not understand the Holocene to have commenced ten to thirteen thousand years ago. The threshold at which the Holocene commenced probably is much earlier, just as the threshold of a new glaciation and effective determination of the Holocene period will occur at a time when there is no evidence of increasing glaciation; perhaps even decreasing evident glaciation.
|
|
|
|
Post by poitsplace on May 27, 2009 5:45:06 GMT
Ken, The last (Eemian) interglacial lasted only about 13,000-15,000 years. The current Holocene interglacial is already about 12-13,000 years old. I don't think we have 10,000-20,000 years till the next ice-age. Personally, I would rather live in an interglacial world than an ice-age world. Also, peak oil seems to have occurred last year and peak coal is not very far away (the US has already reached peak coal in terms of BTUs produced and is likely within 15 years of peak coal in terms of tonnage). I don't think we have near enough ECONOMICALLY RECOVERABLE hydrocarbons to keep increasing the CO2 concentration in the atmosphere. It may very well be that the bigger worry is a cooling climate (at least in terms of human population). IWylie That's what I find so stupid about this whole debate...we CAN'T raise CO2 much beyond twice pre-industrial levels. We've ALREADY had half the warming we can expect. The warming is a minor nuisance at worst, a boon at best. Due to the disproportionate warming, and the fact that the observed warming rate is undershooting IPCC guestimates BY A LOT the hot parts of the earth will have hardly any increase and the parts of the earth that are the most inhospitible toward life due to cold will warm the most. Think about it...people vacation where it's warmer. In europe they go to spain. In the US we go south. Even if global warming WERE caused by man...its not at all a gloom and doom scenario. The sea level rises should be quite small...and if you'll compare old maps of many western nations to more recent ones we've actually taken back what was once ocean in spite of sea level increases similar to those expected from IPCC projections. Amazing bit of trivia for you here...a lot of that was technically FREE! The material excavated for new buildings is simply dumped into shallow areas...presto. Developing nations will have the exact same thing happen if they're simply allowed to develop. A lot of the supposedly expensive "adaptation" to climate change would be similar to the land reclamation. People would get heatpumps instead of furnaces. Homes that were put at risk by rising sea levels are already at risk from bad storms...and will simply not be rebuilt if it's not feasible when they'r knocked down. The loss of glacial reservoirs would also be offset by normal development...with new artifical lake/reservoirs taking their place. as always...we're not entirely sure how much of the warming is from CO2 but even if ALL of it's from CO2 (since 1940 at least) it indicates a very low sensitivity. The changes are minor...the costs of adaptation are low. |
|
|
|
Post by icefisher on May 27, 2009 6:23:49 GMT
As for peak oil, that just means that 50% of the recoverable resources have been used. Many people would argue that we have a decade or two to go before the oil resources peak. And if they do, that makes projects like the tar sands and oil shales in Canada, the US mountain states and Venezuela economically viable, as the oil from those projects will fetch high enough prices to pay for the higher costs of delivering them. The carbon emissions from the tar sands and oil shales are much higher than the carbon emissions from the liquid petroleum resources we're currently using. Thats all childish drivel of course. Clowns have been predicting peak oil since the 1930's. They have also been predicting higher prices for those same 70 years. And of course it turned out they were all wrong and didn't know squat about what they were talking about. The price of energy in relationship to income has been decreasing, oil consumption has been increasing and the only thing that hasn't changed is the number of clowns pretending they can predict the future. And of course there has been no shortage of dummies predicting ever increasing pollution. They have been wrong on every count and will undoubtedly continue to be wrong for eternity. Technology and the innovation of free men has stepped in and delivered on every single item of concern over time. Today the vast amount of pollution is being delivered by the third world and a few emerging nations like China that run on government mandated approaches to progress. Leave people to be free unburdened by excess regulation and tar sands and oil shale will be delivered emitting less pollutants and it if is ever established as a negative to the environment. . . .less CO2 as well. That is they will if free enterprise is allowed to work and the busy body do gooders, into everybody else's business than their own, don't screw it all up. |
|
|
|
Post by glc on May 27, 2009 7:57:21 GMT
I answered this in a couple of other threads, but basically it's the natural forcings that are very well modelled in the GCMs. For the Holocene Climate optimum, it was the orbital forcings (Milankovich cycles) that changed the amount of solar insolation in the Northern Hemisphere summer, melting the North American ice sheet over thousands of years.
kenfeldman
Forget the Holocene. We have no thermometer records. You posted a graph which shows 2 clear warming periods of similar magnitude. If you slide the bottom half across ~30 years you'd get a continuous slope. So tell me what caused the 1910-45 warming. Tell me what factors are responsible. If the GCMS are able to model the natural forcings - what were those forcings.
I'm asking this for a very good reason, i.e. I don't think the GCMS are able to model the last ~100 years or so.
|
|
|
|
Post by magellan on May 27, 2009 14:11:19 GMT
Well I have yet to see a calculation of the amount of heat carried by evaporation of water at the surface and its convection from the surface to the upper layers of the troposphere. Also the effect on convection of changes of state and the various latent heats. As your response shows there is only accounting for radiation and absorption. I would be more than happy if radiation was calculated as if from the top surface of the atmosphere (if that is identifiable) in watts per square metre of the surface of the atmosphere. But it is reduced (in all that I have read) to watts per square metre at the surface, then what appear to be simplistic arguments made about the amount of CO 2 in the atmosphere when most of the density of the atmosphere is below the tropopause and is largely bypassed by convection. The hydrologic cycle, clouds and their effects are admitted to be poorly modeled so just taking the top of the atmosphere would be a way out. Of course as the atmosphere appears to have shrunk by 3% this may complicate comparisons. The IPCC definition of forcing relates to top of atmosphere. The hydrological cycle is reasonably well modelled (that's what the forecast models do). This is what helps define the temperature and humidity profile of the atmosphere. The uncertainty is in the small changes to the cycle that occur as a response to warming and which affects the radiative balance by changing water vapour levels and clouds. When it comes down to it though, the earth is roughly a closed system except for radiation in and radiation out. And the amounts of radiation in and radiation out at any one time are not affected by the amount of energy being shifted about the sysem through convection and the like at that same moment. The hydrological cycle is reasonably well modelled (that's what the forecast models do). This is what helps define the temperature and humidity profile of the atmosphere. Does this meet your definition of "reasonably well"? www.atypon-link.com/IAHS/doi/pdf/10.1623/hysj.53.4.671?cookieSet=1Abstract
Geographically distributed predictions of future climate, obtained through climate models, are widely used in hydrology and many other disciplines, typically without assessing their reliability. Here we compare the output of various models to temperature and precipitation observations from eight stations with long (over 100 years) records from around the globe. The results show that models perform poorly, even at a climatic (30-year) scale. Thus local model projections cannot be credible, whereas a common argument that models can perform better at larger spatial scales is unsupported.
|
|
|
|
Post by icefisher on May 27, 2009 19:07:24 GMT
Does this meet your definition of "reasonably well"? www.atypon-link.com/IAHS/doi/pdf/10.1623/hysj.53.4.671?cookieSet=1Abstract
Geographically distributed predictions of future climate, obtained through climate models, are widely used in hydrology and many other disciplines, typically without assessing their reliability. Here we compare the output of various models to temperature and precipitation observations from eight stations with long (over 100 years) records from around the globe. The results show that models perform poorly, even at a climatic (30-year) scale. Thus local model projections cannot be credible, whereas a common argument that models can perform better at larger spatial scales is unsupported.
The study I want to see is a 200 year comparison between the GCMs and the two Farmers Almanacs. The Almanacs claim on the high side of 80% hit rates. The latest ENSO modeling has the GCM coupled ENSO models heavily predicting an El Nino this year and the statistical historical trained models unanimously predicting ENSO neutral. |
|
|
|
Post by nautonnier on May 30, 2009 16:38:39 GMT
Yes a nice spaghetti diagram - and even enlarged I can see no one model that shows a 7 year period of level or cooling temperatures. Plenty of spikes down then up but not a one with a consistent long period. This was a discussion we had a LONG time ago between myself and Steve. Pick out one model from the spaghetti that shows anything like what has happened over the last 10 years. |
|
|
|
Post by nautonnier on May 30, 2009 16:55:27 GMT
The IPCC definition of forcing relates to top of atmosphere. The hydrological cycle is reasonably well modelled (that's what the forecast models do). This is what helps define the temperature and humidity profile of the atmosphere. The uncertainty is in the small changes to the cycle that occur as a response to warming and which affects the radiative balance by changing water vapour levels and clouds. When it comes down to it though, the earth is roughly a closed system except for radiation in and radiation out. And the amounts of radiation in and radiation out at any one time are not affected by the amount of energy being shifted about the sysem through convection and the like at that same moment. The hydrological cycle is reasonably well modelled (that's what the forecast models do). This is what helps define the temperature and humidity profile of the atmosphere. Does this meet your definition of "reasonably well"? www.atypon-link.com/IAHS/doi/pdf/10.1623/hysj.53.4.671?cookieSet=1Abstract
Geographically distributed predictions of future climate, obtained through climate models, are widely used in hydrology and many other disciplines, typically without assessing their reliability. Here we compare the output of various models to temperature and precipitation observations from eight stations with long (over 100 years) records from around the globe. The results show that models perform poorly, even at a climatic (30-year) scale. Thus local model projections cannot be credible, whereas a common argument that models can perform better at larger spatial scales is unsupported.
Thank you Magellan - this was precisely my point. |
|
|
|
Post by socold on May 30, 2009 17:21:27 GMT
Yes a nice spaghetti diagram - and even enlarged I can see no one model that shows a 7 year period of level or cooling temperatures. Plenty of spikes down then up but not a one with a consistent long period. This was a discussion we had a LONG time ago between myself and Steve. Pick out one model from the spaghetti that shows anything like what has happened over the last 10 years. Realclimate already did this for you in their second diagram: 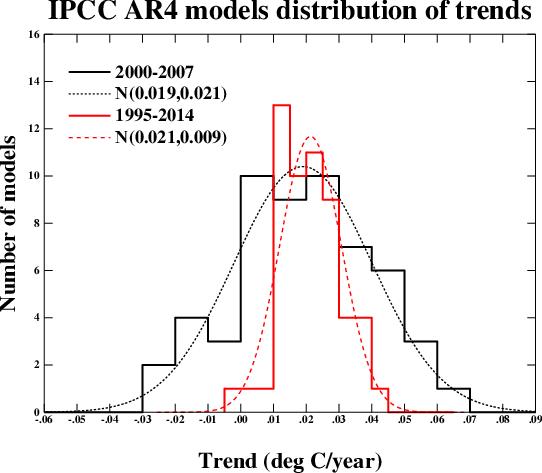 One model even shows a flat trend from 1995-2014 Note that taking a longer period effectively narrows the distribution. |
|
|
|
Post by nautonnier on May 30, 2009 17:32:16 GMT
Yes a nice spaghetti diagram - and even enlarged I can see no one model that shows a 7 year period of level or cooling temperatures. Plenty of spikes down then up but not a one with a consistent long period. This was a discussion we had a LONG time ago between myself and Steve. Pick out one model from the spaghetti that shows anything like what has happened over the last 10 years. Realclimate already did this for you in their second diagram: One model even shows a flat trend from 1995-2014 Note that taking a longer period effectively narrows the distribution. I asked: "Pick out one model from the spaghetti that shows anything like what has happened over the last 10 years." And you say: "One model even shows a flat trend from 1995-2014" Are we into chimpanzees typing out Shakespeare here? Look we got a "Ot be or tno to eb" !!! So chimpanzees can write Hamlet! |
|


