|
|
Post by socold on May 30, 2009 17:44:03 GMT
Realclimate already did this for you in their second diagram: 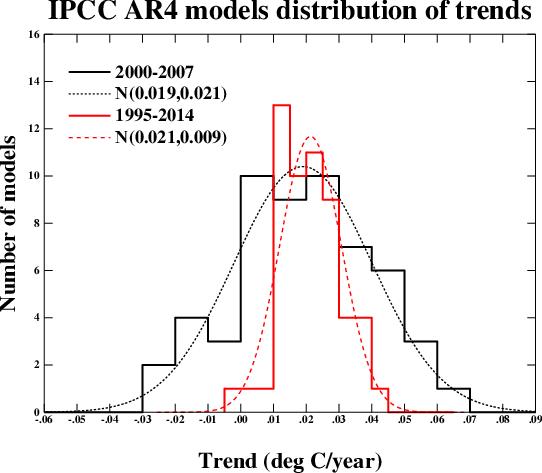 One model even shows a flat trend from 1995-2014 Note that taking a longer period effectively narrows the distribution. I asked: "Pick out one model from the spaghetti that shows anything like what has happened over the last 10 years." And you say: "One model even shows a flat trend from 1995-2014" This is taken from the spagetti. One of the models shows flat trend from 1995-2014. That is "like" what has happend over the last 10 years. |
|
|
|
Post by nautonnier on May 30, 2009 18:46:28 GMT
I asked: "Pick out one model from the spaghetti that shows anything like what has happened over the last 10 years." And you say: "One model even shows a flat trend from 1995-2014" This is taken from the spagetti. One of the models shows flat trend from 1995-2014. That is "like" what has happend over the last 10 years. Sigh.... So you have a model that showed a flat trend 1995 - 2014 meanwhile the global temperatures climbed to the El Nino driven huge peak in 1998 a drop then a steady rise to 2003 followed by a flat trend then drop. Yes - I can see how a "flat trend 1995 - 2014" faithfully followed the global atmospheric temperature changes  Have you ever thought of becoming a military tailor? Is that the best that the brightest 3000 climate scientists in the world can come up with? As was said at the beginning there are no models that show the climate behaviour over the last 20 years - throwing a plate of spaghetti at it in the hope that one might almost be close is not at all what was requested. |
|
|
|
Post by socold on May 30, 2009 18:54:54 GMT
This is taken from the spagetti. One of the models shows flat trend from 1995-2014. That is "like" what has happend over the last 10 years. Sigh.... So you have a model that showed a flat trend 1995 - 2014 meanwhile the global temperatures climbed to the El Nino driven huge peak in 1998 a drop then a steady rise to 2003 followed by a flat trend then drop. Yes - I can see how a "flat trend 1995 - 2014" faithfully followed the global atmospheric temperature changes Have you ever thought of becoming a military tailor? Is that the best that the brightest 3000 climate scientists in the world can come up with? As was said at the beginning there are no models that show the climate behaviour over the last 20 years - throwing a plate of spaghetti at it in the hope that one might almost be close is not at all what was requested. Ah so you are saying the models don't match year by year variations in temperature exactly? Well duh obviously, because the timing of the ENSO-like variation in model runs is not synchoronized with the real world. What is relevant is that the models show periods of 10 years without temperature rise even when the background trend is 0.15-0.2C/decade. Why? Well because of weather noise, because of situations like we have just had of declining ENSO. Therefore the argument that 10 years of cooling in the records falsifies the models is itself falsified, because the models can hardly be falsified by something that they actually show. |
|
|
|
Post by tacoman25 on May 30, 2009 19:35:06 GMT
Sigh.... So you have a model that showed a flat trend 1995 - 2014 meanwhile the global temperatures climbed to the El Nino driven huge peak in 1998 a drop then a steady rise to 2003 followed by a flat trend then drop. Yes - I can see how a "flat trend 1995 - 2014" faithfully followed the global atmospheric temperature changes Have you ever thought of becoming a military tailor? Is that the best that the brightest 3000 climate scientists in the world can come up with? As was said at the beginning there are no models that show the climate behaviour over the last 20 years - throwing a plate of spaghetti at it in the hope that one might almost be close is not at all what was requested. Ah so you are saying the models don't match year by year variations in temperature exactly? Well duh obviously, because the timing of the ENSO-like variation in model runs is not synchoronized with the real world. What is relevant is that the models show periods of 10 years without temperature rise even when the background trend is 0.15-0.2C/decade. Why? Well because of weather noise, because of situations like we have just had of declining ENSO. Therefore the argument that 10 years of cooling in the records falsifies the models is itself falsified, because the models can hardly be falsified by something that they actually show. But you are pointing to one model, when the majority did not show that. Sure, you can always find outlier models...but that isn't what AGW science or the IPCC bases their predictions on. Therefore, if the majority of models are missing what is happening, I really don't see how that should increase our confidence in climate models or the IPCC. |
|
jtom
Level 3 Rank

Posts: 248
|
Post by jtom on May 30, 2009 23:40:31 GMT
So if the IPCC had at least one model of every possible climate variation (which the spaghetti just about does), at least one would be 'correct' and give credence to the general theory? Which cliche do you prefer: a stopped clock is right more often than one that runs a second slow each day; or even a blind squirrel finds an acorn sometimes?
|
|
|
|
Post by socold on May 31, 2009 1:09:43 GMT
Ah so you are saying the models don't match year by year variations in temperature exactly? Well duh obviously, because the timing of the ENSO-like variation in model runs is not synchoronized with the real world. What is relevant is that the models show periods of 10 years without temperature rise even when the background trend is 0.15-0.2C/decade. Why? Well because of weather noise, because of situations like we have just had of declining ENSO. Therefore the argument that 10 years of cooling in the records falsifies the models is itself falsified, because the models can hardly be falsified by something that they actually show. But you are pointing to one model, when the majority did not show that. Sure, you can always find outlier models...but that isn't what AGW science or the IPCC bases their predictions on. Therefore, if the majority of models are missing what is happening, I really don't see how that should increase our confidence in climate models or the IPCC. The decadal variation in the model runs is not expected to line up with the decadal variation in the temperature record. However we can ask "do the model runs with their overall warming trend show 10 year periods of flat temperature?". It doesn't matter when they show it. It doesn't matter if one run shows a flat trend in 2011-2021 and another shows a flat trend in 2005-2015 for example. All that matters is that they do exhibit flat trends over 10 year periods now and again despite the overall warming trend. For that reason we know that the models are compatible with 10 year periods of flat temperature. Therefore it cannot be argued that a 10 year flat trend in the actual temperature record falsifies the models. |
|
|
|
Post by icefisher on May 31, 2009 2:44:24 GMT
However we can ask "do the model runs with their overall warming trend show 10 year periods of flat temperature?". It doesn't matter when they show it. It doesn't matter if one run shows a flat trend in 2011-2021 and another shows a flat trend in 2005-2015 for example. All that matters is that they do exhibit flat trends over 10 year periods now and again despite the overall warming trend. For that reason we know that the models are compatible with 10 year periods of flat temperature. Therefore it cannot be argued that a 10 year flat trend in the actual temperature record falsifies the models. The question isn't whether any models showed flat 10 year trends or not its why did the models show flat 10 year trends from time to time and is that an explanation for the current trend. I think the answer to that is no. Now if we had had a nice big volcanic eruption to provide the explanation for a flat 10 year trend then the model would not be falsified. You are clutching at straws Socold. This is called in the trade "elevating form over substance" and is without question the stupidest thing people do in the financial world. You appear to be providing a perfect example of it. Its assuming stuff because of the form (the flat trend) over the substance (a losing prediction that currently is being saved only by serendipity). So why not invest a few more million instead of counting your lucky stars and getting out while the getting is still good and there are folks willing to pay you well to do so? The real truth is this investment is a dog and its odds on to prove it when that volcano does erupt or maybe even sooner. |
|
|
|
Post by dmapel on May 31, 2009 4:07:16 GMT
The spaghetti cannot be proven wrong until the year 2100. Ain't that it socold?
|
|
|
|
Post by poitsplace on May 31, 2009 4:41:40 GMT
The spaghetti cannot be proven wrong until the year 2100. Ain't that it socold? What you don't see them dealing with is the fact that reality hasn't yet shown the slightest hint of falling into line with the models. The early 1900's warming trend was at about the same rate as the 1980-2000ish trend. To even hit just outside the ERROR BARS of the IPCC models the warming rate would have to double immediately. To actually hit squarely withing the models (at the bottom) the rate would have to almost tripple. |
|
|
|
Post by dmapel on May 31, 2009 4:57:28 GMT
poitsplace: "What you don't see them dealing with is the fact that reality hasn't yet shown the slightest hint of falling into line with the models."
You just don't understand their peer reviewed/scientific consensus logic. It's like a pot of water on the stove. And a watched pot never boils. Just wait for it.
Socold: "Well duh obviously, because the timing of the ENSO-like variation in model runs is not synchoronized with the real world."
It will all be synched up with the real world by the turn of the next century. Even if the temperature has to go up 3-7C in a real hurry. They call it "lag". And if it doesn't work out the way they say it will, they will give us our money back.
|
|
|
|
Post by socold on May 31, 2009 13:19:17 GMT
The question isn't whether any models showed flat 10 year trends or not its why did the models show flat 10 year trends from time to time and is that an explanation for the current trend. I think the answer to that is no. Why? Do you even know why the models show flat 10 year trends? If not how can you answer 'no'? The whole point is that the models tell us that there will be 10 year periods with flat trend that are just caused by internal noise in the climate system. So obviously 10 year flat period in the temperature record does not falsify the models. It's that simple. Despite an overall temperature rise over decades both the actual temperature record and model runs show spikes and troughs as global temperature jumps around the trend. It isn't a smooth year-by-year rising trend. Therefore if you look at just 2 years of temperature record in which the trend is flat and conclude that temperature isn't rising you are missing the forest (trend) for the trees (noise). If you do it with 4 years, same deal. What about 10? Well the models show such flat periods of 10 years, meaning that yes you can't do it with 10 either. We don't need an explaination in this case. The question is whether the temperature record is at odds with the model runs. It isn't. The model runs exhibit 10 year flat periods too. However I have the explaination for the 10 year flat trend 1998-2008 - it's declining ENSO and solar minimum - both which cannot be sustained (the former which has already left the house) |
|
|
|
Post by jimcripwell on May 31, 2009 14:44:59 GMT
socold writes "it's declining ENSO and solar minimum - both which cannot be sustained"
Would you care to elaborate as to why you are certain that the sun cannot maintain the minimum. NCAR dont seem to have a clue as to how strong SC24 is going to be. Apparently you do. The record for the number of spotless days on the sun is something like 3900. Do you know of a reason why this cannot ever occur again?
|
|
|
|
Post by socold on May 31, 2009 14:56:43 GMT
socold writes "it's declining ENSO and solar minimum - both which cannot be sustained" Would you care to elaborate as to why you are certain that the sun cannot maintain the minimum. NCAR dont seem to have a clue as to how strong SC24 is going to be. Apparently you do. The record for the number of spotless days on the sun is something like 3900. Do you know of a reason why this cannot ever occur again? I should have been more clear. It's declining solar minimum which cannot be maintained. At least it isn't being maintained at the moment. Without TSI continually falling there is no increasing negative forcing to offset the increasing positive forcing from GHG. |
|
|
|
Post by icefisher on May 31, 2009 16:08:09 GMT
I should have been more clear. It's declining solar minimum which cannot be maintained. At least it isn't being maintained at the moment. Without TSI continually falling there is no increasing negative forcing to offset the increasing positive forcing from GHG. During the Maunder minimum, (little ice age) minimum was extended for at least 80 years socold. While I can agree its unlikely it not exactly impossible. Further tracking of global temperatures is corollated with heavily smoothed sunspot numbers do you think its possible that recent warming was caused by a recovery from colder times due to extended minimums? Seems to make sense. |
|
|
|
Post by dmapel on May 31, 2009 17:23:11 GMT
socold: "We don't need an explaination in this case. The question is whether the temperature record is at odds with the model runs. It isn't. The model runs exhibit 10 year flat periods too."
Public opinion polls seem to be indicating that your team does have some 'splainin to do, if you want to stifle the Western industrial economies to save the World from catastrophic AGW. Don't you think it is worth the effort?
How many of those model runs exhibit 10 year flat periods over the next ninety years? Is one all you can come up with?
|
|


