nautonnier
could you please review the evidence and sources for the assertion that CO2 is largely unchanged over the past ~100+ years?
I am a definite skeptic, but I am puzzled as to how we can burn as much carbon based fuel as we do and NOT increase CO2 ppm in the atmosphere.
What is the evidence for this static level?
What is the explanation for where the CO2 went?
thanks,
hunter
I am travelling so I don't have access to all my files - but here is a post from the board I have made already. As Sig says there are other papers out on this topic. Now that 'the AGW team' may not have quite the stranglehold on peer review and Journals perhaps we may see some real research being done.
From:
solarcycle24com.proboards.com/index.cgi?board=globalwarming&action=display&thread=937&page=10#36833<<<SNIP>>>quote author=nautonnier board=globalwarming thread=937 post=36833 time=1260119700
I thought it was time for a thread summary so from earlier in this thread...
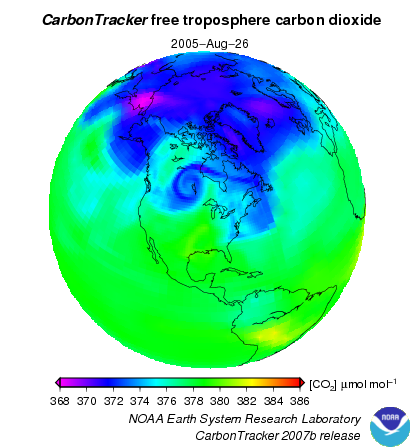
You will note that from this NOAA satellite there is NO huge amount of CO
2 being produced in the USA the great Satan with all those SUVs and coal fired power stations. There *is* a hotspot over central South America. This needs to be explained I am sure that Steve and SoCold will be able to explain how it is.

This is a second NOAA picture in more detail and finer granularity focused on the Great Satan - and strangely most CO
2 seems to be emitted by open country in the North West, Montana or even Canada, and in the Rockies - perhaps this may be due to the volcanism in those areas? It is definitely higher than the industrial 'heartland'.

Now moving onto the monotonic rise in CO
2 graph above Steve has claimed that the huge Indonesian peat fire in 1997 that put >2gt of CO
2 into the atmosphere (more than 3 times that due to aviation) shows on the graph - I cannot see it. Perhaps Steve will produce another graph that does. This does raise ones doubts especially after seeing that AGW proponent scientists have no qualms about fixing the raw data to support their hypotheses.
That leads to the graph below

This graph is based on figures produced before there was a reason to massage CO
2 concentrations. It shows that atmospheric concentrations were higher in the 1800s than they are now - a central plank of the AGW 'hypothesis' appears to be falsified by this. Note also no Indonesia hump in the Mauna Loa figures for 1997. Also interesting is that the graph is based on proxy ice-core data until the 60's - now look at the NOAA image of the Earth again - you will note that the pole is really low compared to the rest of the Earth - is this a sensible place to use proxies that then MAGICALLY run straight onto the other sensed metrics on an island in the mid Pacific. One wonders how many 'tricks' were used to get such an accurate match.... perhaps the arbitrary 83 year move of date was used to hide a decline???
Then there is some concern in the thread about the way the CO
2 levels due to anthropogenic activity are actually being calculated.
If this was a financial institution with this level of disagreement with external financial numbers in a company figures there would be calls for an immediate INDEPENDENT audit NOT a quick
rubber stamp peer review by another member of the AGW 'team'.
<<<SNIP>>>Then two following posts from Graeme
<<<SNIP>>>quote author=gkw board=globalwarming thread=937 post=36865 time=1260134394
Thanks, nautonnier, for a great summary. I checked up on that last graph, since obviously historical CO2 levels is important for the AGW debate, and I hadn't previously seen anything other than the ones used by the IPCC.
The URL on that graph is out of date and the website has been moved to:
www.biomind.de/realCO2/The current graph on that site is:

This clearly shows that historical
measured CO2 levels were comparable to the levels today, but the temperatures reported for those times don't show global warming effects.
Can someone please provide links or references to papers that debunk these figures? If I had to choose between direct measured levels of CO2 and the use of proxies via ice cores, I think I would have to weight my preference to the direct measured levels. I believe that most scientists are fair when viewing data that contradict their hypothesis. Since this graph seems to be a clear refutation of the AGW hypothesis, there must be a reasonable reason why the AGW scientists have discounted this graph. I'd like to know what it is

/quote
<<<SNIP>>>AND
<<<SNIP>>>quote author=gkw board=globalwarming thread=937 post=36866 time=1260134895
That CO2 site is quite interesting. The following graph shows a link between CO2 levels and temperature, but with a five year lag (ie. the CO2 levels go up about five years after the temperature).

More importantly, when the temperature goes down, the CO2 levels go down, too, which isn't what I've read about otherwise. In reference to the paleoclimatic research using ice cores, and how the CO2 levels lagged after the temperature, I've read that the AGW view is that the temperature rises, which triggers a CO2 rise (possibly from the oceans, though that's not confirmed), and that the CO2 rise allows the temperature to rise more (say, by an extra 30-50%).
But that isn't shown in this graph. Given the lag, there is no corresponding 'kick' to the temperature from the rise in CO2 as the above explanation would suggest. The graph clearly shows a link between temperature and CO2 levels, but it doesn't appear to show any significant temperature increase from CO2 level increases. I can't believe that this has been missed by all the AGW scientists, so what's their explanation?
/quote
<<<SNIP>>>Hunter you will note from the graphics that if you wanted to find a LOW CO
2 measurement you would get it at the poles.
If you wanted a HIGH CO
2 reading then the Amazon basin or Central SW Canada would be good.
This map does not look like the picture painted by politicians that have the USA and China as the main source of CO
2 in the atmosphere.
So the AGW 'team' had a choice believe the satellites or adjust the reports to meet their political paymasters' expectations.
We have already seen the response of University of East Anglia and Penn State University is to alter the reports (and the data) to ensure that their research results meet their expectations. Then 'peer review' each others' papers and publish the results withholding the original data and methods.
The ONLY journal/publisher with any kind of ethical scientific approach appears to be the Royal Society which insisted on the original data (yet even that was only after prompting).
I would say that ALL and ANY scientific paper that does not make its original data and meta-data, the provenance of that data and the methods for the research completely and openly available, should be discarded and any paper that uses one of these 'closed' papers as a a basis should similarly be discarded. The scientific citing systems could be used to identify all those papers that are to be removed from scientific literature or flagged with an asterisk and 'DO NOT TRUST THESE RESULTS' overstamped on the Abstract.