|
|
Post by kiwistonewall on Nov 28, 2009 20:24:31 GMT
|
|
|
|
Post by poitsplace on Nov 28, 2009 21:19:25 GMT
And of course, solubility goes up FAR more rapidly with increases in concentration...so all data points to CO2 increases undercutting any projection by the IPCC. We should have EXPECTED that even as increases in CO2 emissions rose the atmospheric content would fail to rise in similar proportions. This is just another example of what happens when idiots are at the helm. They list the degassing of the oceans as a feedback, but ignore that the oceans CAN'T degas as effectively (or in this case actually increase relative solubility) when concentration goes up significantly. They list the additional absorption by CO2 and pretend the absorbing layers will COOL as they absorb this extra energy...while ignoring that the heating they suggest in layers below will disproportionately increase the amount of energy being thrown at those cold layers...AND the added convection that would fight any gradient increase...AND the increased water vapor that would ram the coldest part higher into the warmer stratosphere...AND while that water vapor's increasing night time radiation emissions...which in some ways make it appear "warmer" but also act as a negative feedback. They list arctic sea ice as a purely positive feedback while ignoring that the lower insulation from thinner ice and higher turn-over rate (more ice forms AND melts) means the winter temperatures (when the pole is in darkness for months) increases significantly...a negative feedback. Yes, it's easy to "prove" things to an uninformed public by citing halves of equations that may or may not even have any relevance to the subject. The interesting thing about this chart is the strong NEGATIVE feedback: An increasing amount of CO2 is removed as the oceans cool, but the oceans have to heat much more to produce the same increase in CO2.  |
|
|
|
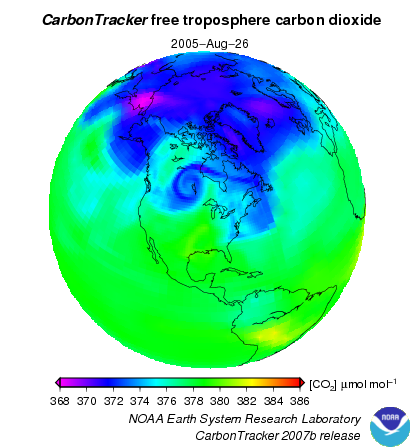
Post by nautonnier on Nov 28, 2009 21:29:22 GMT
That is an interesting chart Kiwi -- two things are apparent... 1. One would have thought that the 'great Satan' would have shown up as a huge source of CO 2 but the biggest hotspot in the Americas appears to be in the Amazon basin. (That actually fits with what you would expect from mature forest) 2. If you wanted to measure somewhere to show a LOW CO 2 the best place would be the Arctic in an ice core perhaps (it would be interesting to see if the same low CO 2 is at the Antarctic). Even in this image...  It is not the industrial areas of the USA that show as generating CO 2 but the wide open countryside the Cascades and Montana - volcanic origins? |
|
|
|
Post by spaceman on Nov 28, 2009 22:44:35 GMT
I do remember very clearly the article stating that co2 was evenly distributed in the atmosphere. Even on here one of the points was that if there were concentrations, then there would be warmer areas than others. We wasted several pages on that discussion. That was central to AGW and global warming that co2 was evenly distributed in the atmosphere. If you find it it is the guy standing in the snow with a gas chronometer in his hand. He may have been mentioned in the news recently. At the end of the article it stated that it meant they could take a reading anywhere and the co2 levels would be the same. It was stated as irrefutable evidence that co2 was causing runaway heating.
Naut, I think they are going to say they are the same (question 2) in the Arctic and Antarctic. If it didn't ,it would throw their combining temps way off. Then they'd have to prove that an increase in co2 caused it to be warmer in certain places. For example, more co2 in northern plains would show an elevated rise in temps in that area. They'd have to prove the delta, the rate of rise as opposed to areas with less co2, rather than making a blanket statement.
|
|
|
|
Post by socold on Nov 28, 2009 23:45:12 GMT
"Somewhat" well mixed would be a better term socold. Well mixed it is not. Why even bother contesting a bare fact? Seriously it's getting to the point that if I said grass is green you would reply "well not if it's dead - then it's pale brown" co2 is a well mixed gas in the atmosphere. That is a scientific fact. It varies from region to region by no more than a few %. That makes it well mixed. |
|
|
|
Post by socold on Nov 28, 2009 23:52:41 GMT
It's not due to co2 being drawn down by cooler water, it's due to plants in the Northern Hemisphere taking in more co2 during summer, while conversely plants in the southern hemisphere are doing the opposite. In northern hemisphere winter the pattern would be opposite - the arctic would show high levels of co2 while the southern hemisphere would show lower. That's the annual cycle in the co2 records. |
|
|
|
Post by sigurdur on Nov 28, 2009 23:53:57 GMT
"Somewhat" well mixed would be a better term socold. Well mixed it is not. Why even bother contesting a bare fact? Seriously it's getting to the point that if I said grass is green you would reply "well not if it's dead - then it's pale brown" co2 is a well mixed gas in the atmosphere. That is a scientific fact. It varies from region to region by no more than a few %. That makes it well mixed. If you said grass is green......I would ask you at what growth stage as I know how grass grows....etc....  Seriously, co2 is NOT considered a well mixed gas. But ...I am not going to argue about that with you. Some of your comments have serious consideration, lately, you have gotten a bit off track...but I consider that a short term trend or a learning curve on both of our parts. |
|
|
|
Post by sigurdur on Nov 29, 2009 0:02:50 GMT
It's not due to co2 being drawn down by cooler water, it's due to plants in the Northern Hemisphere taking in more co2 during summer, while conversely plants in the southern hemisphere are doing the opposite. In northern hemisphere winter the pattern would be opposite - the arctic would show high levels of co2 while the southern hemisphere would show lower. That's the annual cycle in the co2 records. SoCold: your analysis is totally wrong. look at 2008.....jan........then look at 2008....june 1st. By now the plants are growing FAST and sucking up co2 like a demon...yet.....the levels are high....because the ARCTIC has been frozen for a few months......so very easy to see. |
|
|
|
Post by socold on Nov 29, 2009 0:05:51 GMT
Why even bother contesting a bare fact? Seriously it's getting to the point that if I said grass is green you would reply "well not if it's dead - then it's pale brown" co2 is a well mixed gas in the atmosphere. That is a scientific fact. It varies from region to region by no more than a few %. That makes it well mixed. If you said grass is green......I would ask you at what growth stage as I know how grass grows....etc.... Seriously, co2 is NOT considered a well mixed gas. But ...I am not going to argue about that with you. Some of your comments have serious consideration, lately, you have gotten a bit off track...but I consider that a short term trend or a learning curve on both of our parts. sorry if you took the term "well mixed" literally then I over-reacted. There is a term "well mixed gas" that describes any gas in the atmosphere that only varies in concentration slightly. As opposed to non-well mixed gases like water vapor which vary a lot. |
|
|
|
Post by sigurdur on Nov 29, 2009 0:10:03 GMT
If you said grass is green......I would ask you at what growth stage as I know how grass grows....etc.... Seriously, co2 is NOT considered a well mixed gas. But ...I am not going to argue about that with you. Some of your comments have serious consideration, lately, you have gotten a bit off track...but I consider that a short term trend or a learning curve on both of our parts. sorry if you took the term "well mixed" literally then I over-reacted. There is a term "well mixed gas" that describes any gas in the atmosphere that only varies in concentration slightly. As opposed to non-well mixed gases like water vapor which vary a lot. I accept your explanation....In the world I work in, well mixed means less than 1% variation. It is used widely in chem distribution etc. Somewhat well mixed means 10% or less variation.....and that is where co2 would fall. |
|
|
|
Post by socold on Nov 29, 2009 0:12:00 GMT
It's not due to co2 being drawn down by cooler water, it's due to plants in the Northern Hemisphere taking in more co2 during summer, while conversely plants in the southern hemisphere are doing the opposite. In northern hemisphere winter the pattern would be opposite - the arctic would show high levels of co2 while the southern hemisphere would show lower. That's the annual cycle in the co2 records. SoCold: your analysis is totally wrong. look at 2008.....jan........then look at 2008....june 1st. By now the plants are growing FAST and sucking up co2 like a demon...yet.....the levels are high....because the ARCTIC has been frozen for a few months......so very easy to see. January shows high co2 in the northern hemisphere and low co2 in the southern hemisphere: www.esrl.noaa.gov/gmd/webdata/ccgg/CT2009/co2wx/glb/co2wx_hammer-glb_20080101.pdfOver spring and summer plants draw a lot of co2 out of the atmosphere. In fall and winter a lot of co2 goes in the other direction. cdiac.ornl.gov/trends/co2/graphics/Barrow_CO2.jpg |
|
|
|
Post by sigurdur on Nov 29, 2009 0:16:08 GMT
SoCold: your analysis is totally wrong. look at 2008.....jan........then look at 2008....june 1st. By now the plants are growing FAST and sucking up co2 like a demon...yet.....the levels are high....because the ARCTIC has been frozen for a few months......so very easy to see. January shows high co2 in the northern hemisphere and low co2 in the southern hemisphere: www.esrl.noaa.gov/gmd/webdata/ccgg/CT2009/co2wx/glb/co2wx_hammer-glb_20080101.pdfOver spring and summer plants draw a lot of co2 out of the atmosphere. In fall and winter a lot of co2 goes in the other direction. The annual cycle in the northern hemisphere is the opposite to the southern hemisphere. cdiac.ornl.gov/trends/co2/graphics/Barrow_CO2.jpgYes yes....of course it is opposite. The point made to you was that the WATER in the ARCTIC was absorbing copious amounts of co2 being it is so cold. The evidence of that is so easily visible by examining the yearly cycle. NOTE that NA still has high co2 even when the plants are at the growth stage of maximum uptake....June/Early July. After this period, the co2 uptake drops rather dramatically......actually in the neighborhood of 82% because they have shifted from vegetative growth to reproductive growth. No more heavy co2 demand. However...looking at the yearly cycle, it is obvious that by late Sept....long after maximum co2 demand.....that the level of co2 has declined even more substantially....over a very wide area, with the least concentration over the pole. |
|
|
|
Post by spaceman on Nov 29, 2009 0:24:29 GMT
Co2 would have to be evenly mixed in the atmosphere to support AGW. If an area had higher co2 levels then that area would have higher temps according to AGW. If there was no or little change then that would invalid their entire theory. So it had to be evenly mixed or they couldn't have gotten away with this fiction. And as I have been told over and over, a little bit makes a BIG difference. In addition, all THEIR supporting evidence shows the same co2 concentrations where ever they measured them, which I thought was a little strange. So now the story changes??? It'll probably change again as more information is presented to challenge AGW.
Kentucky bluegrass perhaps.
|
|
|
|
Post by magellan on Nov 29, 2009 0:47:37 GMT
There are cyclical cycles of CO2 domes over cities where concentrations exceed 600 ppm, yet they do not exhibit any warming relative to those domes. Why is that?
|
|
|
|
Post by sigurdur on Nov 29, 2009 0:51:16 GMT
There are cyclical cycles of CO2 domes over cities where concentrations exceed 600 ppm, yet they do not exhibit any warming relative to those domes. Why is that? Awwww........mmm......because micro climate is exempt from macro climate? or.......thought number 2....mm.....the sun doesn't shine as brightly through that level of co2?......... or.......dang.....I haven't a clue? |
|