|
|
Post by duwayne on Apr 23, 2016 15:37:45 GMT
In 2007 I surmised that the 60-Year Ocean Current Cycle was entering its Cool Phase and global temperatures would remain flat over the 2007-2037 period despite the warmist warnings that the earth would warm significantly. So far temperatures have been flat. I also predicted that the ENSO (as measured by the Multivariate ENSO technique) and the PDO would be similar to the readings of the last Ocean Current Cool Phase. Nine months ago the MVENSO and PDO readings were right on target. The recent super El Nino has pushed the readings considerably above my predictions. Quarterly Update:  So you would not say there is going to be global cooling? Any thoughts on the potential for a La Nina next winter? Code, I’ve not been shy about making a long term global temperature prediction based on history which includes a 60-year Ocean Current Cycle and an underlying warming which is almost certainly caused in part by CO2. And, based on history, I’ve predicted that there will be an excess of La Ninas over El Ninos during the present Ocean Current Cycle cool phase. And, based on history, a super La Nina or two is likely during the current cool phase. But I don’t pretend to be able to predict the exact timing and magnitude of individual ENSO movements far into the future. In the short term, the odds now would seem to favor a La Nina within the next year, perhaps a strong one. My predictions have always been subject to the proviso that atmospheric CO2 would grow at the past rates and there would be no major volcanic eruptions, no meteorite strikes and no dimming of the sun. So far I’m not convinced the sun’s activity is going drop enough to have a major impact on global temperatures over the next several decades. But there may be a possibility and that’s why I continue to follow the science with interest. Since no one here seems to have made a post with specific long term global temperature predictions based on a dimming sun, I can only conclude that there’s a lot of uncertainty about such a prediction. |
|
|
|
Post by graywolf on Apr 28, 2016 9:50:00 GMT
Any drop in solar will be more than compensated by reductions in mans own efforts a 'dimming'. Because we have never seen 'clear water' since we realised that we were potentially messing with the climate we have to go on the agencies 'guesstimates of just how much potential warming is being lost to 'dimming' . In the noughties NASA put that figure at around 50%? Now China is headlong into reducing its own pollution we should see impacts over the 7 year lifespan of the sulphates they have been throwing up but a rapid drop off in particulate pollution ( the first shower washes that out). As it stands the GHG's are still in the atmosphere that had their impacts hidden by the flip side of the human pollution impacts.
So do we reckon we have seen 0.5c human driven temp rise since the 50's? NASA tell us that should be 1c but 50% was shielded by particulate/sulphate pollution. As we clean up the GHG's already in place find expression and we 'catch up' to where we ought to be.
Of course we also then see full impact from the year by year increases on top of the 'readjustment'to more representative temps for the GHG burden.
Personally i do not think a drop in solar will offset this by enough to see temps fall.
Then we have the redistribution of energy on the planet. It takes 80 calories of energy to melt 1 gram of ice. It takes 1 calorie to raise the temp of 1 gram of water by 1c. how much less ice , come Sept, do we see in the Arctic Basin compared to the 80's? So where does that 'freed up' energy go???
|
|
|
|
Post by sigurdur on Apr 28, 2016 13:18:18 GMT
Graywolf:
You are ignoring the data that shows the atmosphere has been clearing since 1996. Yes, China pollutes but over all its level of pollution doesn't overcome the decline of pollution by other countries.
Your assumptions are based on a high sensitivity to CO2. Current science indicates a lower sensitivity.
Worldwide, the climate has entered a very tranquil state. The past 30 years of temperatures indicate that the previous climate state was hugely unbalanced. Evidence put forth by measurements indicates that another .5-1.0C of warming will be beneficial for mankind.
Our world as a whole is greening, deserts are shrinking.
What is not to like about this?
|
|
|
|
Post by phydeaux2363 on Apr 28, 2016 14:30:04 GMT
I'm with you on this, Mr. Sig. For Mr. Wolf and his ilk, disaster is always just around the corner. Their trend lines always go in the most alarming direction indefinitely, even though nature doesn't EVER work that way. And, they ignore the benefits of CO2 greening and the fact that, where humans are concerned, warm is better than cold. So I ask Mr. Wolf; what exactly do you propose humankind do to prevent the apocalypse you so gleefully predict is coming? Turn off the power grid? Stop driving and flying? End agriculture so your beloved planet can go back to what it was before humans evolved? On that note, what makes you think that humans are not part of nature? It's not like we came here as some sort of alien invasion, bent on destruction. You need to sit back, relax, and stop fixating on every square kilometer of arctic ice that melts. Go to a movie, or concert. Travel to a great city and enjoy the wonderful creations of humankind. It's all going to be OK. Unless Donald Trump becomes president of the US. Then, we're all doomed.
|
|
|
|
Post by duwayne on Apr 28, 2016 15:01:46 GMT
Any drop in solar will be more than compensated by reductions in mans own efforts a 'dimming'. Because we have never seen 'clear water' since we realised that we were potentially messing with the climate we have to go on the agencies 'guesstimates of just how much potential warming is being lost to 'dimming' . In the noughties NASA put that figure at around 50%? Now China is headlong into reducing its own pollution we should see impacts over the 7 year lifespan of the sulphates they have been throwing up but a rapid drop off in particulate pollution ( the first shower washes that out). As it stands the GHG's are still in the atmosphere that had their impacts hidden by the flip side of the human pollution impacts. So do we reckon we have seen 0.5c human driven temp rise since the 50's? NASA tell us that should be 1c but 50% was shielded by particulate/sulphate pollution. As we clean up the GHG's already in place find expression and we 'catch up' to where we ought to be. Of course we also then see full impact from the year by year increases on top of the 'readjustment'to more representative temps for the GHG burden. Personally i do not think a drop in solar will offset this by enough to see temps fall. Then we have the redistribution of energy on the planet. It takes 80 calories of energy to melt 1 gram of ice. It takes 1 calorie to raise the temp of 1 gram of water by 1c. how much less ice , come Sept, do we see in the Arctic Basin compared to the 80's? So where does that 'freed up' energy go??? Graywolf, you point out that aerosols cool the earth. Then would you agree that when/if global warming becomes a problem, it can be offset by adding aerosols to the atmosphere? Should we inject some aerosols into the upper atmosphere to cool the planet? Is that worth discussing? What is the "right" temperature for the earth? Is the best choice a combination of lots of CO2 in the atmosphere to green the planet with some aerosols high in the atmosphere to control the temperature at the optimum level? |
|
|
|
Post by icefisher on Apr 28, 2016 17:38:12 GMT
Any drop in solar will be more than compensated by reductions in mans own efforts a 'dimming'. Because we have never seen 'clear water' since we realised that we were potentially messing with the climate we have to go on the agencies 'guesstimates of just how much potential warming is being lost to 'dimming' . In the noughties NASA put that figure at around 50%? Now China is headlong into reducing its own pollution we should see impacts over the 7 year lifespan of the sulphates they have been throwing up but a rapid drop off in particulate pollution ( the first shower washes that out). As it stands the GHG's are still in the atmosphere that had their impacts hidden by the flip side of the human pollution impacts. So do we reckon we have seen 0.5c human driven temp rise since the 50's? NASA tell us that should be 1c but 50% was shielded by particulate/sulphate pollution. As we clean up the GHG's already in place find expression and we 'catch up' to where we ought to be. Of course we also then see full impact from the year by year increases on top of the 'readjustment'to more representative temps for the GHG burden. Small correction. . . .in the naughties NASA had no figures for aerosol dimming as they had no idea if aerosols had a warming or cooling effect. Only when NASA's warming predictions did not pan out they looked to aerosols as a potential reason. Like all that NASA has done in the past several decades on climate the ideas that politically rise to the top need to be validated. Personally i do not think a drop in solar will offset this by enough to see temps fall. Well NOAA once had a prominent chart up showing how temperatures had tracked solar activity for the past 150 years. The only criticism I have heard of that chart was that it did not include the flat temperatures of the late 18th and early 19th centuries bringing into question whether the rise in temperature of the past 150 years was due to a recovery from the LIA as it was believed the amount of solar modulation during the industrial age was insufficient to cover all the warming. I think the realists at NOAA have recognized forever a great deal of unknowns regarding climate change. One theory that might explain the discrepancy which I developed was the fact that the growth of glaciers continued until the early 19th century from the LIA dip in temperatures. This growth may have fueled a loss of heat for climate temperatures to rise via the albedo effect. Once those glaciers reversed direction circa 1820 to 1850 the albedo effect reversed itself and warming progressed. Coincidentally that progression coincided with the industrial revolution. But the greatest rate of glacial loss occurred in the 19th century and in the 20th century the rate of loss has been lower. . . .just the opposite of the emissions of the industrial revolution. Raw data suggests that temperature peaked in 1940's, adjusted data says otherwise. Whatever is correct if either is correct the topping of solar activity sometime in the 1980's, the birth decade of the climate alarmists for warming snuffing out the climate alarmists for cooling, along with how cooperative the sun has been in giving us some substantial variation, we should be able to sort this out in the coming decade assuming the sun continues to cooperate. Then we have the redistribution of energy on the planet. It takes 80 calories of energy to melt 1 gram of ice. It takes 1 calorie to raise the temp of 1 gram of water by 1c. how much less ice , come Sept, do we see in the Arctic Basin compared to the 80's? So where does that 'freed up' energy go??? It is interesting how ice (like in its potential effect on delaying warming during the little ice age recovery) seems to be a trailing indicator which makes sense as it does seem to take a long time for ice to melt and presumably build up again. It does not seem all that surprising that the alarmists around 2007 switched their focus from temperate zone warming to polar zone warming in light of it being about a decade without warming and it was only the polar zone warming that kept temperatures rising, especially with the help of hindcasting climate models to fill in the temperatures prior to around 2008 when efforts to record polar temperatures greatly accelerated. It was really perplexing that this warming appeared to be regional with only the northern pole involved, but when looking for shelter any roof will do. I think the coming decade 2017 to 2027 will be immensely interesting. Solar variability should hit a low by around 2021, give the upper ocean 6 years or so to adjust (like the continued pause 2009 to date through the solar max of 2013). We have a lot to learn. |
|
|
|
Post by nautonnier on Apr 30, 2016 10:41:27 GMT
It radiates to space - at the speed of light.
|
|
|
|
Post by fredzl4dh on May 3, 2016 12:03:52 GMT
Japans data set no statistical warming from 1997-2016.
Temperature anomalies.http://www.data.jma.go.jp/cpdinfo/temp/list/mon_jpn.html
/photo/1?ref_src=twsrc^tfw
|
|
|
|
Post by fredzl4dh on May 3, 2016 12:07:38 GMT
|
|
|
|
Post by missouriboy on May 19, 2016 15:27:34 GMT
|
|
|
|
Post by duwayne on Jul 12, 2016 15:18:44 GMT
In 2007 I predicted the 60-Year Ocean Current Cycle was entering its 30 year Cool Phase and as a result global temperatures would on average be flat over the 2007-2037 period despite the warmist warnings that the earth would warm significantly. So far the average temperatures have been flat. I also predicted that ENSO (as measured by the Multivariate ENSO technique) and the PDO would be similar to the readings of the last 30-year Ocean Current Cool Phase. A year ago the MVENSO and PDO average readings were right on target. The recent super El Nino , however, has pushed the readings considerably above my predictions. Quarterly Update: 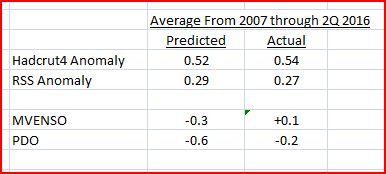 |
|
|
|
Post by acidohm on Jul 12, 2016 15:37:11 GMT
In 2007 I predicted the 60-Year Ocean Current Cycle was entering its 30 year Cool Phase and as a result global temperatures would on average be flat over the 2007-2037 period despite the warmist warnings that the earth would warm significantly. So far the average temperatures have been flat. I also predicted that ENSO (as measured by the Multivariate ENSO technique) and the PDO would be similar to the readings of the last 30-year Ocean Current Cool Phase. A year ago the MVENSO and PDO average readings were right on target. The recent super El Nino , however, has pushed the readings considerably above my predictions. Quarterly Update: Just give it 6 months Duwayne. .... |
|
|
|
Post by dontgetoutmuch on Aug 23, 2016 16:08:12 GMT
That is indeed an informative graph. Notice how 1936 isn't even a blip? Part of the problem we are dealing with is that a lot of the data we see now has been massaged into oblivion. July of 1936 was much hotter then that graph shows. The fact that you can't pick out the late 1930's as at all unusual shows that the data has been tortured into submission.
|
|
|
|
Post by missouriboy on Aug 23, 2016 18:13:15 GMT
In 136 years of modern record-keeping, July 2016 was the warmest July according to a monthly analysis of global temperatures by scientists at NASA's Goddard Institute for Space Studies (GISS).earthobservatory.nasa.gov/IOTD/view.php?id=88607
At no station along this cross section is July 2016 a record ... not even close. In fact, it's about 3 C below july of 2012. Note the effects of Pinatubo in 1991. Now that was a downturn! Note the standard highs in the 1930s and 1950s. The Martians think that NASA is over-weighting those vast, unpopulated northern expanses in order to get this result. Yes, we know that the North American Grain Belt is not the center of the World. But it is the center of the North American continent. They would like an explanation from NASA ... but they are not expecting one.  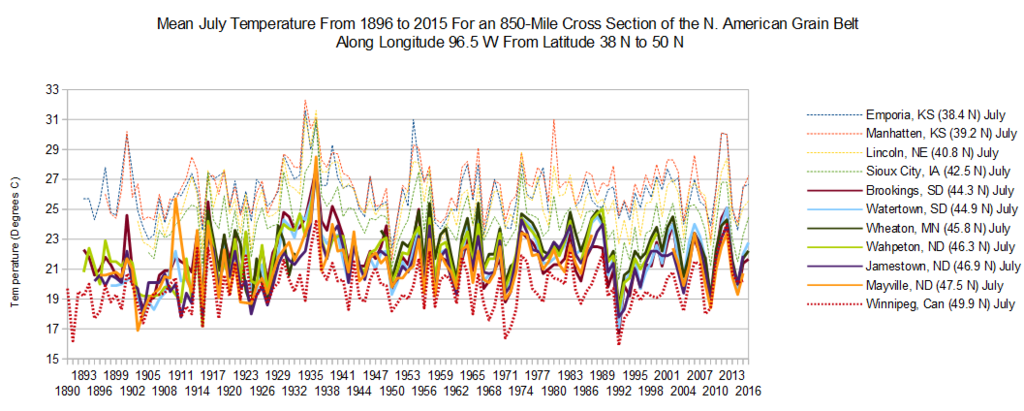 |
|
|
|
Post by Ratty on Aug 23, 2016 23:39:50 GMT
MB, the GISS doom graph is anomalies. Yours is mean temps. Can you make any direct comparison for this ill-equipped reader?
Be gentle .....
|
|