|
|
Post by icefisher on Mar 4, 2012 2:24:04 GMT
With the February numbers in the UAH trend is now flat. .006 degree C/decade. With that rate of warming one would not be able to detect the increase in temperature a thousand years from now.
I've also added a little something, to kind of highlight this is one of the most biased 10 year periods that can be selected given that it starts near a solar maximum and ends in a deep solar minimum.Do you still support the idea of unrealized warming in the system? If you do you should know that works strongly against short term cooling events for at least 10 years. With cooling beginning in 2002 as indicated in the attached chart showing the eroding cooling trend now almost to its 10th year.  Note how fast it came out of the 1996 minimum! UAH bottomed 7 months after the minimum! We are now 2 1/2 years beyond that! Solar minimum was 3 1/4 years ago. The warming peak coming out of that minimum ended 2 years after the minimum in 1998.
Also of course there's that PDO switch that happened years ago.
And despite both of these things UAH still doesn't show a negative trend...
Edit: Show the PDO fall over this period:
www.woodfortrees.org/plot/uah/from:2002.5/plot/uah/from:2002.5/trend/plot/jisao-pdo/from:2002.5/normalise
if we zoom back we can see this particular 10 year in context. It's clearly biased:
PDO:
www.woodfortrees.org/plot/uah/from:2002.5/plot/uah/from:2002.5/trend/plot/jisao-pdo/from:1980/normalise/plot/jisao-pdo/from:1980/normalise/from:2002.5/trendThis is fine Socold. But a cold PDO means less radiation to space. That means even more heat is missing than calculated. The solar cycle and the PDO regularly go down, but then they come back up. Using just a 10 year timeframe you can easily capture just a "down". The period since 2002 happens to capture a down for both.That might be meaningful if we could locate the missing heat from the PDO. But ARGO suggests its cooling down to 700 meters and this is several hundred meters below the thermocline where convection and conduction rule. Probably more heat being taken down there by warm blooded fishes than anything else. There is virtually no chance the heat is hiding below that.
If PDO and solar cycle had gone up in the last 10 years and there had been warming, that would be an actual argumentYeah too bad you no longer have an argument for global warming. |
|
|
|
Post by socold on Mar 4, 2012 20:18:23 GMT
With cooling beginning in 2002 as indicated in the attached chart showing the eroding cooling trend now almost to its 10th year. Cooling would be if the 10 year trend went negative. It hasn't gone negative: Interestingly though it went negative in 1996/1997 and in 1989. Did you think the warming had stopped back then too? Serious question: Why wouldn't you have thought that? Such a 10 year trend graph is affected by ENSO not just solar. Coming out fast of the "1996" minimum is due to the 1997/1998 El Nino - it's simply that a 10 year trend ending in 1997 or 1998 is biased high by the El Nino. The massive jumps up and down in the 10 year trend graph is precisely why you shouldn't be using 10 year trends. Any particular 10 year trend doesn't tell you whether global warming is continuing or stopping. As I mentioned previously the negative 10 year trend to 1996 for example didn't herald an end to warming. Try a 30 year trend graph, it reduces a lot of the ENSO and solar cycle noise. ARGO does show warming below that depth:  I do. It's best summarized by this:  My version isn't as polished but it's the same argument: 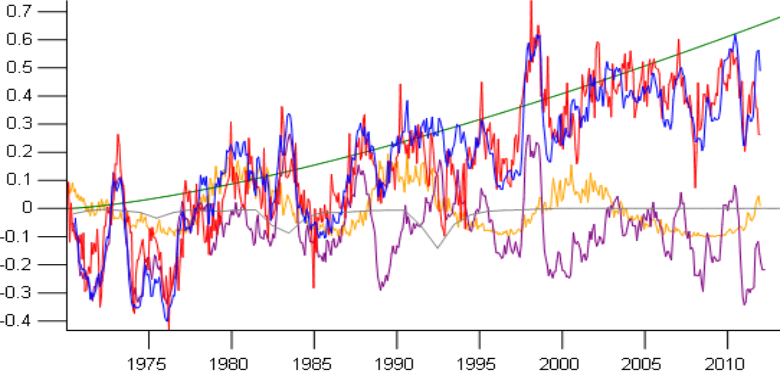 I am perfectly happy for you to predict global cooling or an end to warming like a lot of other skeptics. It makes for a very prominent and interesting credibility test of AGW to see whether the world continues warming in the next 5 years or cools. duwayne asked about the green line in the above graph: If the green line is correct then warming accelerates over time. But a linear increase would probably also fit just as well, as might a decelerating curve and I remember someone on here showed a flat line since ~2002 works too. My point with the graph is to show that hadcrut temperatures to date do not rule out continued warming. |
|
|
|
Post by socold on Mar 4, 2012 20:46:33 GMT
GISTEMP is closer to what has actually happened at the surface. Really socold, can you never find fault with GISS even when they completely rewrite historical records and make up data where no measurements are taken? You have no idea whether GISS is better or not. That's what you want it to be. My position is based on the following evidence. New analysis released today has shown the global temperature rise calculated by the Met Office's HadCRUT record is at the lower end of likely warming.www.metoffice.gov.uk/news/releases/archive/2009/land-warming-recordAnd completely separately from that the new HadCRUT4 record confirms this. The addition of more high latitude stations increases the warming in recent years. In fact it looks like 2005 will be warmer than 1998:  www.metoffice.gov.uk/media/pdf/1/e/PresentationMOSAC_16.4_Gordon.pdf www.metoffice.gov.uk/media/pdf/1/e/PresentationMOSAC_16.4_Gordon.pdfThis is obviously much closer to GISTEMP than HadCRUT3 that shows 1998 as the warmest. |
|
|
|
Post by icefisher on Mar 5, 2012 0:05:27 GMT
Cooling would be if the 10 year trend went negative. It hasn't gone negative:
Interestingly though it went negative in 1996/1997 and in 1989. Did you think the warming had stopped back then too? Serious question: Why wouldn't you have thought that?
El Chichon in 1982 and Pinatubo in 1991 in combination with La Ninas and of course the solar minimums of 1987 and 1996. I have little doubt that icebergs could be floating down the Hudson River past Hansen's office and the two of you would be in your cubicles studying model readouts and 30 year trend charts. Today we may not even have a La Nina. We remain in a neutral phase of ENSO and the current neutral may not even qualify as a La Nina unless it changes direction and starts getting colder. Yet a solar max with neutral ENSO is dipping just as deep as the super deep solar minimum incombination with a strong La Nina in 2008. If a Katla blow, for example, had produced the current cooling then you might have a point. Biggest sign of cooling is on the above chart where the decadal solar awakening El Nino hardly created a bump in the chart. Such a truncated warming bump has not been seen for a 100 years. And all parallels with 1989 and 1997 went out the window in 2009. So you will no doubt continue to deny any analysis and focus exclusively on the past linear trend. |
|
|
|
Post by duwayne on Mar 7, 2012 13:45:58 GMT
Here’s my global temperature forecast for the 21st Century along with the basis for same. There’s nothing really new here since the information is covered in previous posts stretching back to the “old” Board. I like to post the forecast every once in a while to encourage others to offer their long-term predictions or to tell me where I’m wrong. The forecast is based on 6 climate observations. 1) There’s been a definitive 60-year global temperature cycle at least since 1850. 2) The naturally occurring Pacific Decadal Oscillation (PDO) and El Nino/Southern Oscillation (ENSO) are strongly net positive during the 30-year temperature up legs and strongly net negative in the 30-year flat or down periods. This provides a clear explanation for the cycles. 3) The claim by some that reduced aerosol concentrations caused the temperatures to be flat in the 1947-1977 period is not only questionable, but appears to be wrong because…. a) Scientists have been unable to develop clear relationships between aerosols and temperatures for their climate models and instead resort to “fudge factors”. Some aerosols cool such as the volcanic aerosols, but other aerosols warm. Why are the fudge factors right? b) Before 1947 there were 2 previous 30-year flat or declining periods which were clearly not caused by aerosols. Something which fails even in its attempt to explain only 1 of these 3 flat periods lacks credibility versus something which explains all 3. c) Temperatures have flattened in the early 21st Century despite accelerated growth in CO2 and no significant aerosol reduction. 4) There is a long-term upward trend in global temperatures which accelerated when CO2 concentrations started to grow rapidly in the first half of the 20th Century. The accelerated growth covering more than 60 years could be mostly caused by of CO2 although an active sun and other natural warming effects may have played a role as well. 5) There’s a clear scientific basis for CO2 driven global warming of about 1.2 C per doubling of atmospheric CO2 concentration. 6) Some scientists believe the climate system may multiply the basic CO2 warming effect on global temperatures through feedbacks by a factor of 3 or even higher while other scientists believe the climate system offsets the primary warming to some degree such that the overall warming is something like 0.7C or even less per doubling of atmospheric CO2 concentration. The observations including those in recent years are more consistent with the lower numbers. Further discussion The power of the 60-year global temperature cycle is shown in this periodogram posted on Cycle24 several years ago by “Basil”. The input data were the Hadcrut3 anomalies from 1850 to 2007. The periodogram algorithm searches for periodic cycles in the data. Curves above the double red line are statistically significant, the further above the line the more significant.  The 60-year cycle is both very regular and very statistically significant. The cycle can also be easily seen on a plot of the Hadcrut3 temperature data. As seen below, for periods when the data are available, PDOs and MVENSOs are significantly net positive over the 30-year periods when global temperatures rise and net negative during the alternate 30-year periods when they are flat.
                  Global
                 Temperature
                   Trend           Average PDO            Average MVENSO

1917-1947     Up                     +0.37                 (No data)
1947-1977     Flat                    -0.63                    -0.29
1977-2007     Up                     +0.43                     +0.38
2007-2011     Flat                    -0.80                     -0.39
Neither the PDO nor the MVENSO remain positive or negative every year throughout the 30-year periods, but on average their tendencies are consistent and in the same direction. There are other Ocean Currents which oscillate over time as well such as the Atlantic Multidecadal Oscillation (AMO). I lump all these together under the general category of Ocean Currents. Solar activity could have played a role in the overall warming during the 1850-2011+ period and could even have played a significant role as a driver of the Ocean Current oscillation. But other than the 9-13 year solar cycle, a significant solar effect is less obvious and clear, in my opinion, than the roles played by CO2 and the Ocean Currents. However, I would not totally rule out significant cooling from a Maunder Minimum sort of event in the future. The Forecast My specific forecast is based on a continuation of the current growth rate of CO2 emissions and is as follows: The 2007 “trend” temperature is 0.5C based on a least-squares trend of the 1977-2007 Hadcrut3 data. As Ocean Currents shift to the down leg (already evident in the PDO and MVENSO data) and offset CO2 warming, trend temperatures for 2007-2037 will remain flat overall at 0.5C although individual years will fluctuate with ENSO and the 9-13 year solar cycle. For 2037-2067 temperatures will climb on average at the same rate as 1977-2007 to a Hadcrut3 anomaly trend anomaly of 1.0C as Ocean Currents and increasing CO2 push temperatures in the same direction. Then with a reverse in the Ocean Currents Hadcrut3 global temperature anomalies will average around 1.0C for the 2067-2097 period. This will mean the global temperatures will increase about 0.7C from the beginning to the end of the 21st Century. The temperature growth could be slower, if, in fact, there is a significant dimming of the sun or a major volcanic eruption or a large meteor strike occurs. I labeled my original forecast MaxCon 1.0 with the idea that I would update it to 2.0 or whatever as better information came along on things like aerosols or other temperature drivers such as secular solar activity. So far I’ve seen no reason to update since the Hadcrut3 anomalies are in line with predictions and the PDO turned negative right on schedule in 2007 while the IPCC models with their “no significant natural temperature drivers approach” have greatly overestimated the rate of warming. Others have made forecasts based on Ocean Current effects and they are sometimes similar to mine. I am not claiming originality (the academics worry more about that sort of thing) although I’ve not seen any specific forecast which is a real close match to mine. Note: updated on 4/9/2012 to replace ONI data with MVENSO data |
|
|
|
Post by trbixler on Mar 7, 2012 15:01:09 GMT
More on 60 year temp cycle. 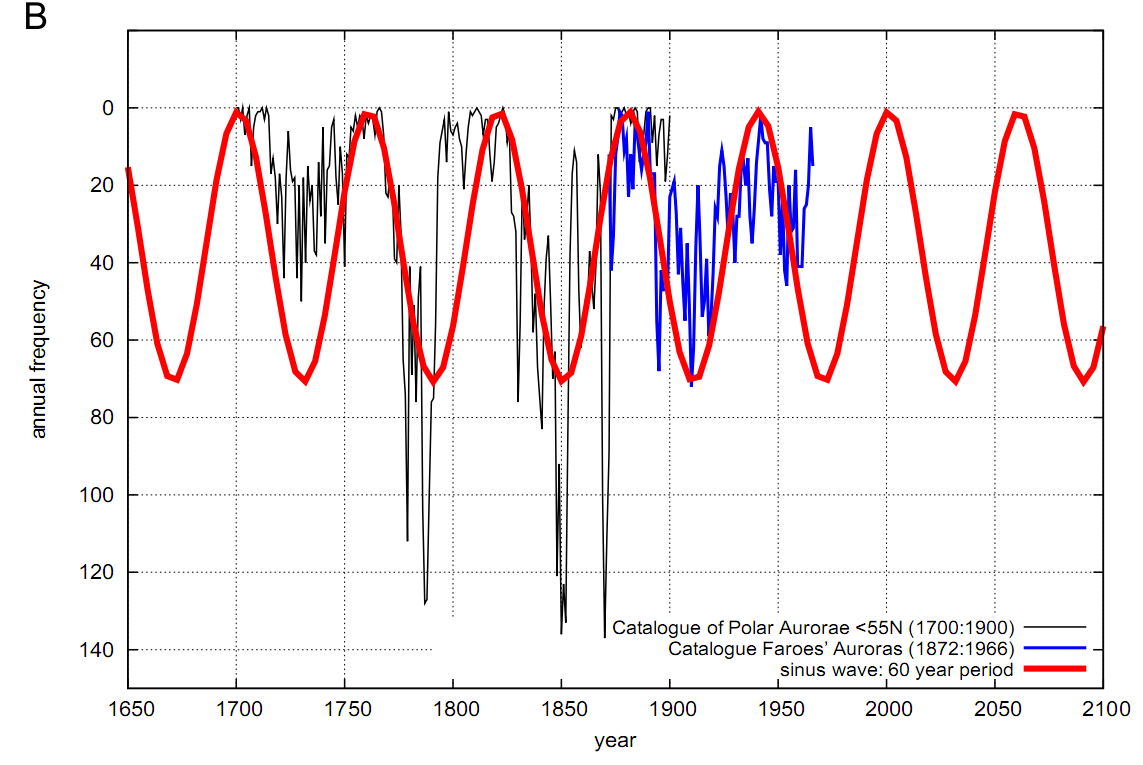 "Dr. Scafetta has written several papers on the 60 year trend in global temperatures that align with a 60 year trend in the Solar velocity records. This same trend aligns with PDO record which is a warm and cool phase of the Pacific Ocean that also aligns with the frequency in the ENSO cycle (whether La Nina or El Nino’s dominate). This new paper demonstrates a 60 year period in the mid latitude auroras that suggests a solar output astronomical link in the 60 year cycle. The theory suggests that during times of low solar output the reduced solar wind allows more cosmic rays to excite the outer atmosphere which then enhance any solar flare activity to a state whereby aurora can be visible at mid latitudes. The 266 year history for the most part does look to show a 60 year fluctuation with perhaps an irregularity around 1950-60. I am not totally convinced with this logic as mid latitude aurora can be a function of an over active Sun also which is in competition. (note: my initial reading of the paper was incorrect, see update below)" "On reading the paper there are several references to a planetary influence on the Earth’s magnetosphere and how increased cosmic flux excites the outer atmosphere leading ultimately to more mid-latitude auroras (and changes in cloud cover). My reading being from a solar/planetary background was that the planets were affecting solar output thereby influencing the solar wind and ultimately affecting our magnetosphere and cosmic flux levels received. This is not the thrust of Dr. Scafetta’s paper which points out a possible planetary effect directly on our magnetosphere. This in my opinion greatly changes the magnitude of what I think is a very important enlightening new paper." landscheidt.wordpress.com/ |
|
|
|
Post by socold on Mar 24, 2012 12:34:23 GMT
Cooling would be if the 10 year trend went negative. It hasn't gone negative:
Interestingly though it went negative in 1996/1997 and in 1989. Did you think the warming had stopped back then too? Serious question: Why wouldn't you have thought that?
El Chichon in 1982 and Pinatubo in 1991 in combination with La Ninas and of course the solar minimums of 1987 and 1996. You agree that a declining solar cycle and declining ENSO can mask at some warming over a 10 year period. So how much warming do you think the solar cycle and ENSO have masked over the period 2002-2012? Without such a figure how can you know if your flat trend 2002-2012 is global warming stopping or just global warming being masked? |
|
|
|
Post by steve on Mar 24, 2012 16:20:21 GMT
Duwayne, I think your guy's statement that above the red line is "statistically significant" is a meaningless statement - statistically significant of what. We know temps were warm in the 1940s, and there was a cooling dip in the early 1900s. So I suspect the plot is merely emphasising these features that we already know about. Doesn't really prove that there is a causal link with anything in particular.
|
|
|
|
Post by sigurdur on Mar 24, 2012 16:29:56 GMT
Socold:
Global warming is not being masked. I find it remarkable the papers written that try to prove this point using non-existent data, only modeled data.
ARGO, thank goodness for ARGO, shows that the oceans as a whole are not warming, the surface temp metrics are not showing warming globally etc.
Clmate is what it is. A LOT more variable on a global scale than AGW folks want to admit. There have always been hot areas, cold areas, and normal areas on the surface (land) as well as the oceans.
|
|
|
|
Post by socold on Mar 24, 2012 18:07:50 GMT
Socold: Global warming is not being masked. So the solar minimum and La Ninas have caused no cooling since 2002? |
|
|
|
Post by astroposer777 on Mar 24, 2012 18:20:33 GMT
Socold: Global warming is not being masked. So the solar minimum and La Ninas have caused no cooling since 2002? Socold, I remember a link posted on one of the SC24 threads which provided almost real time global temp data, I think it came from you. If that is correct, would you post it again. The computer I bookmarked it on is out of service and I cannot find it via google. |
|
|
|
Post by sigurdur on Mar 24, 2012 18:34:41 GMT
socold:
La Nina and El Nino only move heat. They do not create nor consume heat.
As far as solar minimum, the small change in TSI is not enough to reflect the change in surface temperature we have observed.
Dr. Svalgaard's recent research shows that the TSI hasn't varied much during the 20th century. This blows a huge hole in the early 20th century warming as presented by AGW folks.
Bring this to their attention and they don't like it at all.
Ok...here is my take:
1. TSI is pretty constant is seems. This is based on the latest research and observations. Within the TSI there are variations. Some say this causes the jet stream to change etc, others say no effect.
2. There is a very strong correlation between solar cycles and large drainage basin discharge. From this inferrence, we know that solar cycles DO have some type of effect on clouds, etc. And also may have an effect on Hadley's, Ferrel's, etc.
3. I really do not think that the Climate Scientists have a good understanding of how climate actually works. It saddens me that they are so dog gone hung up on CO2. Their minds are so closed, or appear to be closed.
4. The dynamics of climate, not weather now, but actual climate seem to be stepped to step changes. There was a new paper published recently which I can't seem to find in my archives.......stupid me for not saving it........that showed Greenland temps on an annualized basis. Shell studies also seem to be able to do this. While not nearly as good as actual measurements, they can show trends, but not temps within a season. THIS is important to climate.
5. I think that this seasonal variation is the most overlooked aspect to global climate.
CO2 is a greenhouse gas, but it just isn't magical. We now know that there is H2O vapor much higher in our atmosphere than previously thought. As we both know, H2O has a much wider spectrum than the minute one of CO2.
The more I understand about climate, the more I realize how little really is known. For me, each answer produces 2 more questions. I get no monetary gain, nor job security if I publish something that will have more grants coming my way. I depend on climate to grow crops, and the weathermen are not so good at predictions coming true, hence my intense study of climate while I can.
I look at the methodology of papers and just shake my head. I look at proxy data selection, and just shake my head. I know I am not the brightest bulb in the universe, but the junk science has about overwhelmed my sense of decency.
When you get a paper, and I did post that paper a bit ago, showing OBSERVATIONS that prove the models wrong...and then folks argue the observations must be wrong I fear that all is lost.
I have, to me, very valid concerns about CO2 emissions. However, the thought process of the main projectors of climate science has become so poor that any arguement is lost before I open my mouth. Clouded with uncertainties...etc....etc.
It is very prudent to live conservatively. I do so. It is not prudent to try and force society to spend ever increasing amounts of scarce cash on "maybe's", when there is starvation, pesilence etc throughout the world.
We have been blessed to have a resource that has allowed mankind to advance tremendously. Our concern should not be on how we can tax this resource, but on how we can best use it for the continued advancement of mankind. All the dollars spent on worthless papers, time, etc.....are not bearing any productive fruit.
I would hope that the "mask" is off, and that great minds are once again allowed to explore, roam freely.
|
|
|
|
Post by sigurdur on Mar 24, 2012 18:41:09 GMT
The single greatest threat to mankind and climate has been/is the "Team" approach. I talked to a proxy specialist who published a paper approx a month ago. He is from the Univ of Ontario at Quebec. He was dismayed at tree rings, and Dr. Mann. He told me of his journey to get his paper published. It really opened my eyes more. IF you think there isn't tremendous pressure applied to the journals on what to accept you are sadly mistaken. Dr. Mann wrote a book full of inuendo and out right lies. He pats himself on the back....not once looking in the mirror and seeing a scoundrel. He has become just such. And Dr. Hansen isn't much better...nor Dr. Trenbeth. And ya know what really irks me?  ?...... These folks are ALL paid by the US taxpayer. |
|
|
|
Post by socold on Mar 24, 2012 20:24:41 GMT
"La Nina and El Nino only move heat. They do not create nor consume heat."
La Nina moves heat from the surface, so that creates a cooling effect on surface temperatures.
"As far as solar minimum, the small change in TSI is not enough to reflect the change in surface temperature we have observed."
But how much cooling effect have both these elements had?
If the solar minimum has caused 0.1C global cooling since 2002 and ENSO has caused 0.1C global cooling since 2002 then that's a total of 0.2C global cooling between the two of those factors since 2002.
Then if global surface temperature is flat since 2002 it means ENSO and the solar cycle have masked warming of 0.2C since 2002.
|
|
|
|
Post by socold on Mar 24, 2012 20:27:04 GMT
So the solar minimum and La Ninas have caused no cooling since 2002? Socold, I remember a link posted on one of the SC24 threads which provided almost real time global temp data, I think it came from you. If that is correct, would you post it again. The computer I bookmarked it on is out of service and I cannot find it via google. I am not sure if it is me. The only link I have which fits is this one but it probably isn't the one you are thinking of. ds.data.jma.go.jp/tcc/tcc/products/climate/synop.html |
|


 ?......