|
|
Post by Andrew on Feb 10, 2014 7:39:25 GMT
So says the fraudster who claimed radiation from a cold object could not be absorbed by a hotter object and relentlessly lied that I had changed goal posts, so he could deliberately create the disgusting scenario that I was a proven liar. What kind of a sick pervert does that? |
|
|
|
Post by sigurdur on Feb 10, 2014 10:26:04 GMT
Magellan that's why I said implied, just didn't quite word it very well. Going by the AGW theory. Of course a rise to those levels wouldn't do much more than have crops and worldwide vegetation booming. Also I heard 89% of the USA coal plants are being shut off on Jan 1 next year. Is this correct? If the Obama administration had its way, the number would be 100%. But....no, there will be very few coal fired power plants shut down next year. There is no other source to produce the elec required to heat ones homes. And ya know what is really funny? Folks get uncomfortable when it is hot, but if you want to really wake someone up......tell them the elec will be shut off when it is -20F. |
|
|
|
Post by sigurdur on Feb 11, 2014 4:30:04 GMT
www.clim-past.net/9/2379/2013/cp-9-2379-2013.htmlAbstract. Understanding recent Arctic climate change requires detailed information on past changes, in particular on a regional scale. The extension of the depth–age relation of the Akademii Nauk (AN) ice core from Severnaya Zemlya (SZ) to the last 1100 yr provides new perspectives on past climate fluctuations in the Barents and Kara seas region. Here, we present the easternmost high-resolution ice-core climate proxy records (?18O and sodium) from the Arctic. Multi-annual AN ?18O data as near-surface air-temperature proxies reveal major temperature changes over the last millennium, including the absolute minimum around 1800 and the unprecedented warming to a double-peak maximum in the early 20th century. The long-term cooling trend in ?18O is related to a decline in summer insolation but also to the growth of the AN ice cap as indicated by decreasing sodium concentrations. Neither a pronounced Medieval Climate Anomaly nor a Little Ice Age are detectable in the AN ?18O record. In contrast, there is evidence of several abrupt warming and cooling events, such as in the 15th and 16th centuries, partly accompanied by corresponding changes in sodium concentrations. These abrupt changes are assumed to be related to sea-ice cover variability in the Barents and Kara seas region, which might be caused by shifts in atmospheric circulation patterns. Our results indicate a significant impact of internal climate variability on Arctic climate change in the last millennium.
|
|
|
|
Post by duwayne on Apr 4, 2014 17:40:17 GMT
I make it a practice to follow up on my predictions and this perhaps is a good time to check my prediction from a couple of years ago that in the not too distant future the “Climate Scientists” will themselves “discover” the 60-year ocean cycle - the 60-year cycle which is so obvious in the AMO history, the PDO history and in the global temperature history itself – and will dare to project it into the future. I see the article referenced by Graywolf on another thread www.nature.com/news/climate-change-the-case-of-the-missing-heat-1.14525 as a sign of progress toward this prediction. Without acknowledging that the sceptics and luke-warmers were correct, this article indicates that the “Climate Scientists” have finally “discovered” that aerosols were not the cause of the flat global temperatures in the 1947-1977 period and they have finally acknowledged that the models have been very wrong with respect to global warming rates and did not foresee the “hiatus”. Some are finally admitting the possibility that flat temperatures could continue for another 15 years due to the ocean cycle. But so far the “Climate Scientists” are being dragged to the realities of the 60-year cycle after the fact rather than predicting it – at least publicly. But reading between the lines, I think privately many of the more thoughtful “Climate Scientists” now accept the reality of a quasi 60-year cycle. But the “Climate Scientists” as a group may not publicly tout a 60-year ocean cycle until after the next inevitable El Nino and the inevitable La Nina which will follow. After 20+ years of flat temperatures, they will need a good reason why temperatures are going to increase in the future. Surely, the public will have lost faith in the old models and the 60-year cycle will offer the best hope for why global warming will resume. |
|
|
|
Post by sigurdur on Apr 4, 2014 18:09:59 GMT
And that is why global warming will resume, if it in fact does. I think the sun/ocean effect will have to be in investigated more robustly.
And I still have that nagging idea that CO2 actually enables further cooling of the oceans.
|
|
|
|
Post by sigurdur on Apr 19, 2014 15:27:01 GMT
|
|
|
|
Post by duwayne on May 15, 2014 20:45:56 GMT
I review my 7 year old global warming prediction here each quarter, but the Hadcrut3 anomaly still hasn’t been updated for March. It’s clear the Met Office is going to focus their attention on Hadcrut4. So I’ll switch my prediction to Hadcrut4. I’m still going to argue that this is a 7 year old forecast since the methodology is exactly the same as I’ve used for my previous prediction. The method is described in previous posts. solarcycle24com.proboards.com/thread/95/global-warming-temperature-predictions?page=74 My prediction for Hadcrut4 then is that it will remain flat for 2007 to 2037 at 0.51C which is the 2007 trend number based on the 1977-2007 least squares calculation. This compares to 0.47C for the Hadcrut3 anomaly. Through March of 2014 or over 20% of the way through the 2007-2037 period the actual average Hadcrut4 anomaly is 0.46C or 0.05C below the predicted level. Hadcrut3 was 0.06C below the prediction through February. The average MVENSO so far is -0.3 vs the -0.4 prediction. The average PDO is -0.6 which is as predicted. |
|
|
|
Post by duwayne on Jun 8, 2014 18:18:37 GMT
Every year or so on this board, I restate my global warming forecast using slightly different words and charts. I say “restate” rather than “update” since my basic forecast hasn’t changed since 2007 and, so far, as I show every quarter, it’s been pretty accurate, particularly when compared to the IPCC predictions. But I want to deal with some issues that might concern people about my predictions - the fact that my forecast is pretty simple, the fact that I don’t have a PhD in Climate Science, and the fact that I don’t have a computer model.
Let’s say I wanted to predict how much the hair on my head will grow next year. So I hire a group of prestigious bioscientists to develop a computer simulation model of how food is taken into the body, digested, absorbed into the bloodstream, delivered to the hair follicles and converted into hair. Let’s say the scientists come up with several predictions which range between 12 and 36 inches with a consensus of 24 inches.
Then after 1 year I find my hair has grown only 6 inches. I then have 2 options for forecasting the growth for the following year. Use historical “Pattern Recognition” and forecast the same rate as the previous year or go back to the scientists for another try at “Process Simulation”.
If after a few years, my hair keeps growing at the rate of 6 inches per year and the bioscientists keep predicting a much higher rate, there’s no doubt I would go with the Pattern Recognition method, the method which doesn’t require a sophisticated model or , in fact, any understanding of the underlying process of growing hair.
Fortunately, in the case of global warming we now have 70 years of data showing how global temperatures change while atmospheric carbon dioxide increases at a relatively steady rate. This information, limited somewhat by our ability to measure it, is from the perfect model, the earth itself. Every rule of physics has been followed. No variable has been omitted.
Pattern Recognition requires a careful analysis of the key variables and their effect on the historical results. But it doesn’t require a total synthetic process simulation, or a climate scientist. And, in my opinion, it’s a logical best choice for preparing a global temperature prediction for the case where atmospheric CO2 continues to grow steadily at the historical rate and process simulations are totally inaccurate.
|
|
|
|
Post by nautonnier on Jun 16, 2014 21:29:37 GMT
|
|
|
|
Post by sigurdur on Jul 9, 2014 18:38:46 GMT
|
|
|
|
Post by duwayne on Jul 29, 2014 21:28:44 GMT
The Hadcrut4 June anomaly is now available so here’s my quarterly global warming forecast update. This particular update is a milestone in that we are now 25% of the way (7 ½ years) through the cool phase of the 30-year ocean current cycle. First off, let me list my excuses. I only spend a couple of minutes a day on climate stuff. Secondly, I don’t have a degree in climate science. Thirdly, I don’t have government funding. Fourthly, my forecast hasn’t been adjusted in 7 ½ years. And I don’t have access to supercomputers. Here’s my forecast compared to actual. 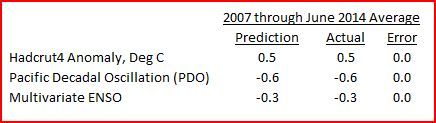 That’s right, all the predictions are on track at this time. In a few days I’ll repost the forecast rationale which I've posted in a slightly different format in the past. |
|
|
|
Post by sigurdur on Jul 29, 2014 22:13:13 GMT
Dwayne You are too humble.
|
|
|
|
Post by throttleup on Jul 29, 2014 22:30:41 GMT
Dwayne, you missed your calling!
|
|
|
|
Post by duwayne on Aug 4, 2014 22:34:10 GMT
Here’s an update of my 2007 global warming forecast based on the Hadcrut4 anomalies which the Met Office now seems to prefer. The methodology is exactly as used in 2007 but with Hadcrut4 anomalies substituted for Hadcrut3 in the calculations. So I’ll still refer to this as a 2007 forecast. The focus is on long-term global temperatures in a world where the developing countries continue to advance and, as a result, the world’s CO2 emissions continue to grow rapidly. Rapidly growing atmospheric CO2 isn’t a new thing. Growth began early last century and accelerated in the late 1940’s and from the 1970’s to the present was about 0.5% per year. During that time Mother Earth has provided us with data showing exactly what happens to global temperatures when atmospheric CO2 grows rapidly. This isn’t theory. The results are available. Here are the Hadcrut4 Global Temperature Anomalies from 1850 to 2007. They rose slightly over this period. But the rise isn’t at all smooth.  One can observe the short term ups and downs associated with ENSO and the cooling effects of major volcanic eruptions. And if you look carefully, there is also a clear 60-year cycle. This periodogram shows the strength of this 60-year cycle. By comparison, the effect of the 11-year solar cycle on temperatures is weak.  With 7-year averaging to smooth out the effects of ENSO and volcanoes, we can more clearly see that while CO2 is growing steadily, global temperatures grow in spurts of 30 years followed by 30 year of flat or declining temperatures. Hadcrut 4 smoothed  These global temperature 60-year oscillations closely correlate with the Atlantic Meridional Oscillation (AMO), a measure of ocean current driven temperature fluctuations in the Atlantic Ocean as shown below. The temperature data are detrended to highlight the oscillations. AMO vs Hadcrut4  Likewise, the Pacific Decadal Oscillation shows the same 60-year oscillation. And the ratio of El Ninos to La Ninas also varies in tune with the 60-year cycle. The table below summarizes temperature anomalies and CO2 atmospheric growth. The data are shown for 30-year periods covering the warm and cool Ocean Current oscillations. Remember that these data are not theoretical. They are directly from the perfect model, the Earth. They show what actually happens when CO2 grows rapidly as in the last 60 years. 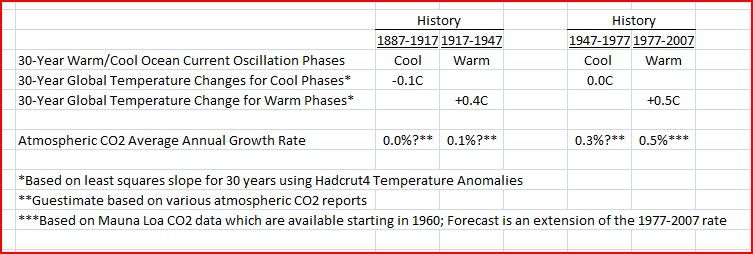 Note that the temperatures for the 2 cool phases are very similar with the later phase showing only 0.1C warming over the earlier period. Likewise the second 30-year warming phase shows only 0.1C more warming despite the substantial difference in CO2 growth rates. The approximately 60-year temperature oscillations appear in proxy data dating back several centuries. Some believe the cycles are driven by the sun, some believe they are driven by the planets and some believe the cycles occur naturally without any oscillating force from the sun and planets. But whatever the reason, they happen. My expectation back in 2007 was that the approximately 60-year ocean current cycle would continue as it has for a long time and the Earth will continue to doggedly follow the rules of physics and remain oblivious to politics, public pressure and the inaccuracies of modelers. If atmospheric CO2 continues to grow at 0.5% per year, we can look to history when atmospheric CO2 grew at 0.5% to see what happens to global temperatures. Here is my forecast from 7 ½ years ago but using Hadcrut4 anomalies. 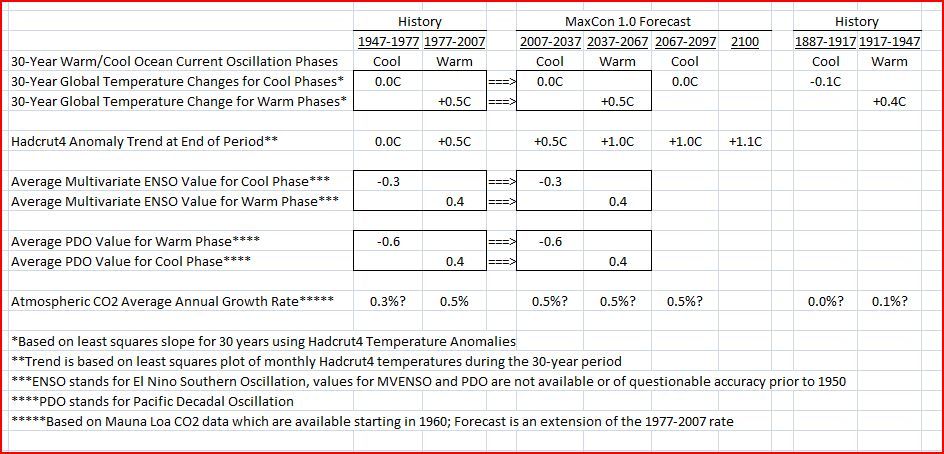 The forecast of flat temperatures for 2007-2037 refers to the multiyear trend. Monthly and yearly global temperatures will, of course, continue to fluctuate with ENSO. And any major volcanic eruption will depress temperatures accordingly. Here is the forecast in chart form. Global Warming Prediction Chart ![]() 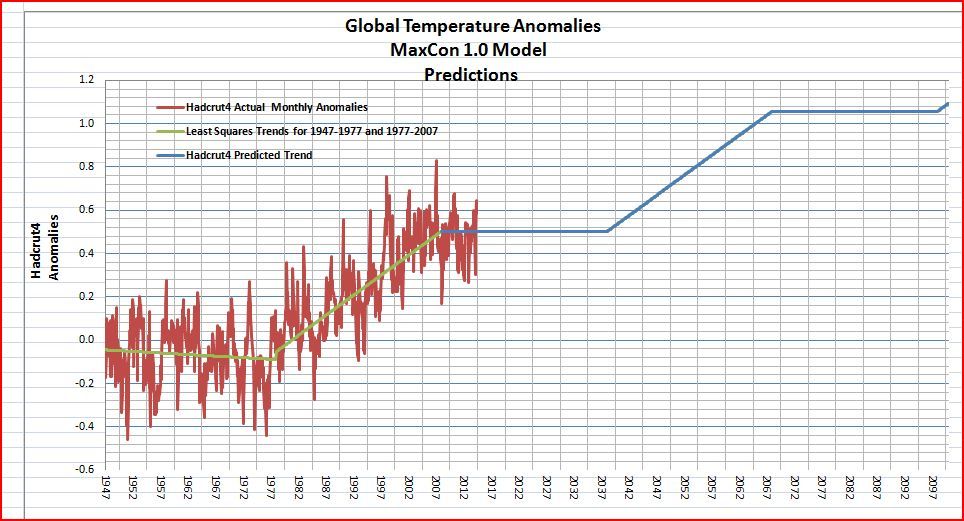 What has happened since the forecast was made in 2007? As predicted, the Ocean Current Cycle, after 30 years in a warm phase has returned to its cool phase. The PDO has turned negative and the AMO appears to have peaked. And as predicted, global temperatures have been flat. Table of Forecast vs Actual In my view there are 4 things which could render the forecast inaccurate. 1) A long term massive volcanic eruption would mean exceptional cooling. 2) A major change in the rate of CO2 growth could cause more or less long term warming. 3) A large meteor strike could have a major cooling effect. And 4) if the sun should dim significantly over a multidecadal period, the earth will cool accordingly. My model which I labeled MaxCon1.0 works in the real world but, according to some, it doesn’t work in the theoretical world. On the other hand, the global circulation models are good in theory according to their proponents, but they don’t work in the real world. Why would you believe that CO2 has more far more warming power than it’s ever exhibited? Questions and comments are encouraged. I’ll post something later which speaks to some of the questions I’ve received in the past. |
|
|
|
Post by nautonnier on Aug 5, 2014 1:12:53 GMT
Just a few thoughts.
Everyone accepts that the oceans, atmosphere, planetary orbits etc etc make up a coupled chaotic system of chaotic systems, yet although they _know_ that, they then proceed to treat the climate system as linear and deterministic. So it is stated - the sun heats in 11 year cycles and we cannot see the 11 year cycles in the metrics. Well you won't will you? That is the outcome of a chaotic system.
What you can get is perodicity of the attractors that make up the complex chaotic system - and you may be able to measure that. But that is not related to any cyclical imput, it is an emergent periodicity from the current behavior of the attractor(s) and may or may not continue.
So when it is said 'the solar cycles are not visible in the metrics of the climate system' - the answer should be 'why would you expect to see them - it is a chaotic system. With a chaotic system an external input of _just_ the right amount at _just_ the right time can have a large effect. The wrong amount or the wrong time and there is no effect - even if the input is far greater. Like giving an ankle throw - timed right even a large person falls over, timed wrong and you can kick hard but they won't fall over.
Wiggle watchers always want things to be comfortably deterministic and linear - well they are not.
|
|


