|
|
Post by duwayne on Apr 8, 2013 15:00:03 GMT
The difference between the aerosol issue and the ocean cycle issue is that the aerosol issue relates to incomplete understanding of observations (how much aerosol of all the different types is emitted, how far it travels and so forth) as well as the fact that they have uncertain impact on clouds. So you can argue that the amount of aerosol, or the detail of how they interact with clouds could be a "plug factor" but that doesn't mean they have *no* discernible impact, or that we cannot understand anything about their impact. With oceans, there is also a physical understanding that is incomplete. But ultimately, they influence atmospheric temperatures in physically understandable ways - releasing heat, taking up heat, helping cause more, or less clouds etc. etc. So an "ocean cycle" theory ought to be able to speculate on what it is about the ocean state can have the purported influence. [as an aside, the implication that the models were fixed to match 20th Century warming is based on a misunderstanding of how models are developed. Models are developed to match climatology. Also climate models parametrize clouds. So if models sensitive to warming (e.g. have strong positive cloud forcing causing fewer cooling clouds and more warming clouds) turn out to be sensitive to aerosols in the opposite direction (aerosols cause more cooling clouds), it perhaps should not be a surprise as when testing the model against climatology it is the total cloud effect that is looked at.] Steve, I'm going to show you how to determine the Ocean Cycle "plug factor" without fully understanding all the interactions. I'll also show you why the aerosol plug factor is wrong. And I'll show you why the Ocean Cycle plug factor makes sense. But first, I'd like to understand your global warming prediction. Is the IPCC mid-range forecast your best guess? [responding to your "as an aside..." Hansen says no one really knows what impact the aerosol removal had on temperatures because firstly there were no good measures of the quantity and location of the various atmospheric aerosols during the period when these aerosols were removed and secondly,even if there were, because of the lack of data, there is no certainty as to what the impact of removing those aerosols might have been on temperatures. CO2 has been studied to death and there's nothing close to agreement on it's impact on temperatures when the feedback is included. Hansen uses language rarely used by scientists when he says the aerosol forcing is "extremely" uncertain. Generally the term highly uncertain is good enough to indicate the data shouldn't be used. So how do you select a plug factor under those limitations? The problem with all the models without the plug factor is that they do not show the flat temperatures from 1947-1977. The model temperatures are far too high. So they try a series of plug factors. It's only logical to assume that the better plug factor is the one which causes the model to better fit the observations. If you want to argue that there is a good scientific basis for the plug factor answer these three questions. Why did you first call it a plug factor several years ago? Where can I find the scientific basis for the plug factors which somehow overcomes the lack of information on amount, location and effect? And why would Hansen and others disagree with you?] |
|
|
|
Post by duwayne on Apr 11, 2013 15:44:08 GMT
“Greenhouse gases” cause global warming. But when global temperatures remained flat for 30 years during 1947-1977 while atmospheric CO2 was increasing every year, an explanation was required. The aerosol explanation never made scientific sense. There is no doubt that the right aerosols in the right place in the atmosphere can significantly impact global temperatures, sometimes up, sometime down, depending on the specifics. But, the limited data available doesn’t even come close to supporting the climate scientist cohort’s conclusions that aerosol reduction caused the lack of warming. The climate scientists who came to that conclusion seemed to be emboldened by the fact that an alternate explanation for the flat period, a drop in Solar radiation, was short on scientific data as well.
But, the 1947-1977 flat period wasn’t unique. The Hadcrut3 data show another distinct cooling period for 1887-1917 following 30 years of a warming trend. In fact, there is a definite 60-year global temperature cycle in the Hadcrut3 data. Here are the Hadcrut3 least squares slopes of the global temperatures for five 30-year periods. The Hadcrut3 data are only available back to 1850.
1857-1887 +0.005
1887-1917 -0.004
1917-1947 +0.014
1947-1977 +0.003
1977-2007 +0.017
Statistically speaking, this cycle is very regular and very well defined. The differences in the slopes for the adjacent periods are -.009, +.018, -.011 and +.014, respectively, very significant changes in direction.
For the periods where PDO and ENSO data are available, the slower growth periods coincide with significant negative PDO’s (Pacific Decadal Oscillation) and significantly lower average ENSO readings. The opposite is true during the 30-year periods warming periods. The switch from cold to warm and back in the PDO exactly matches the beginning and ending dates of the congruent 30-year periods.
All of the above is factually true, but some argue that it is not sufficient to prove that the cycle is anything other than some grouping of random events which happen to fit a pattern which looks like a cycle. What is missing is an unassailable scientific explanation as to why this cycle exists.
My life’s experiences have taught me there is no way of delivering a proof of the cycle sufficient to block the onslaught of attacks from those whose interests are best served if this theory never sees the light of day. So back in 2007, even though there are more arguments I could have brought to bear, I chose to stop there and just accept that the case wasn’t proven, but the timing was such that I knew that the theory would be blown up or further supported by observations within a few years. And the observations, of course, are what really matter.
So based on this admittedly circumstantial evidence, back in 2007 I predicted that
1) The PDO would reverse to its cool phase in 2007
2) The MVENSO (multivariate ENSO) would turn negative on average beginning in 2007
3) Global temperatures would trend flat over the 2007-2037 period, similar to the flat trend in 1947-1977.
To measure the flat trend in the early years I proposed that the global temperatures on average would remain near the least squares trend value for 2007 based on the 1977-2007 data. The Hadcrut3 anomaly calculated by this method is 0.47C.
So far these predictions are proving to be quite accurate with the Hadcrut3 anomalies for 2007-2012 averaging marginally below the predicted value at 0.41C, not far above as the climate models were predicting. I update the actual versus prediction every 3 months or so.
So you be the judge, does the aerosol explanation make sense? Are global temperatures surging higher? Or is the growing circumstantial evidence sufficient to conclude there may be an Ocean Cycle and temperatures may remain flat for another 25 years?
As always is the case, there’s a lot more that could be said but I only spend a couple of minutes a day on this stuff and I’m already well over my 500 word self-imposed target. Maybe I need a hundred thousand dollar grant like the climate modelers instead of my less than $1 budget.
|
|
|
|
Post by steve on Apr 11, 2013 18:18:32 GMT
duwayne, I suspect that temperatures bobbing up and down over a few by +/-0.2C-0.3C have been a feature of the climate for billions of years, and that it is related to a combination of increased or decreased volcanic activity, heightened ENSO state in one direction or another, and combining with a solar impact. That seems to be the evidence when you look at the high frequency proxies (which do pick out more extreme events - only they turn out to be local to that particular proxy). The current warming is going above this, the level is in line with expectations. As I have said before, the 1947-1977 flat trend region is in my view partly an artefact of the 1940 high. It's the 1940 high that doesn't have an explanation. But also, if you look at the guesses about the different forcings, CO2 is well in the pack in terms of variations in these forcings up to quite recently.  |
|
|
|
Post by magellan on Apr 11, 2013 20:18:55 GMT
duwayne, I suspect that temperatures bobbing up and down over a few by +/-0.2C-0.3C have been a feature of the climate for billions of years, and that it is related to a combination of increased or decreased volcanic activity, heightened ENSO state in one direction or another, and combining with a solar impact. That seems to be the evidence when you look at the high frequency proxies (which do pick out more extreme events - only they turn out to be local to that particular proxy). The current warming is going above this, the level is in line with expectations, and is happening quite rapidly. As I have said before, the 1947-1977 flat trend region is in my view partly an artefact of the 1940 high. It's the 1940 high that doesn't have an explanation. But also, if you look at the guesses about the different forcings, CO2 is well in the pack in terms of variations in these forcings up to quite recently. Whose expectations? Met O doesn't even say that anymore. You forget to link to the SkS propaganda video  |
|
|
|
Post by steve on Apr 11, 2013 21:49:33 GMT
Expectations of the models - even if some analyses have it verging on edging outside the 90% probability envelope. The Met O still say this.
BTW I've never watched any SkS videos.
The "it is happening quite rapidly" bit is tautology and unnecessary. The level is in line with expectations - full stop. I'll edit the post.
|
|
|
|
Post by magellan on Apr 11, 2013 23:38:28 GMT
Expectations of the models - even if some analyses have it verging on edging outside the 90% probability envelope. The Met O still say this. BTW I've never watched any SkS videos. The "it is happening quite rapidly" bit is tautology and unnecessary. The level is in line with expectations - full stop. I'll edit the post. The picture is linked to SkS so it is obvious your statement is a direct offshoot from SkS. Cite your source and when the prediction was made to support any of that statement, or is an expectation not the same as a prediction. It's always word games with you. |
|
|
|
Post by magellan on Apr 12, 2013 0:19:43 GMT
|
|
|
|
Post by magellan on Apr 12, 2013 0:30:45 GMT
|
|
|
|
Post by magellan on Apr 12, 2013 1:20:47 GMT
|
|
|
|
Post by Pooh on Apr 12, 2013 5:25:00 GMT
duwayne: Responding to Steve, you write "Statistically speaking, this cycle is very regular and very well defined." ... "But some argue ... What is missing is an unassailable scientific explanation as to why this cycle exists." I think Bob Tisdale makes a plausible case for " A" mechanism, not necessarily the one and only mechanism. Part of the mechanism I think of as trade winds causing sloshing in the Pacific Basin. My words, not Tisdale's. Tisdale, Bob. “Edition 2 of Book ‘Who Turned on the Heat? – The Unsuspected Global Warming Culprit, El Niño-Southern Oscillation’.” Scientific. Bob Tisdale - Climate Observations, November 14, 2012. bobtisdale.wordpress.com/2012/11/14/edition-2-of-book-who-turned-on-the-heat-the-unsuspected-global-warming-culprit-el-nino-southern-oscillation/Preview available here: Tisdale, Bob. “Everything You Every Wanted to Know About El Niño and La Niña….” Scientific. Bob Tisdale - Climate Observations, September 3, 2012. bobtisdale.wordpress.com/2012/09/03/everything-you-every-wanted-to-know-about-el-nino-and-la-nina-2/Current Reference Pages - ENSO, EMI, SOI, SST, Global Sea Surface Temperature – 30 Days, etc. Interesting. Includes animations of graphed data over time. wattsupwiththat.com/reference-pages/climatic-phenomena-pages/enso/
|
|
|
|
Post by cuttydyer on Apr 12, 2013 10:53:24 GMT
|
|
|
|
Post by steve on Apr 12, 2013 18:22:17 GMT
Can we stop the game playing now steve? Met O has changed their "forecast" multiple times over the years. Below is from 2007 courtesy of Paul Homewood. And as many will recall, Met O quietly changed it again just recently as a SC24 forum member (sorry, forget who it was) discovered.  We're at cross-purposes here, as should be clear from my responses. 1. There is the long term expectation that amounts to an expectation of 0.2C warming per decade around now. Based on normal expected natural variability and given the spread of the different models, the divergence between temperatures and the central projection is not significant yet/still. 2. There are the decadal projections which are experimental. These attempt to assimilate ocean observations to generate a model with a reasonable initial state. The Met O first attempt was published around 2004 and was based on HadCM3. The second was released late last year just before some poor scientist went home for his or her Christmas dinner, and was based on a later model. The later forecast is clearly different from the earlier as duwayne noticed!!! |
|
|
|
Post by steve on Apr 12, 2013 18:25:37 GMT
This is a version of a model-obs comparison based on the CMIP3 models that were run prior to the last IPCC assessment report: 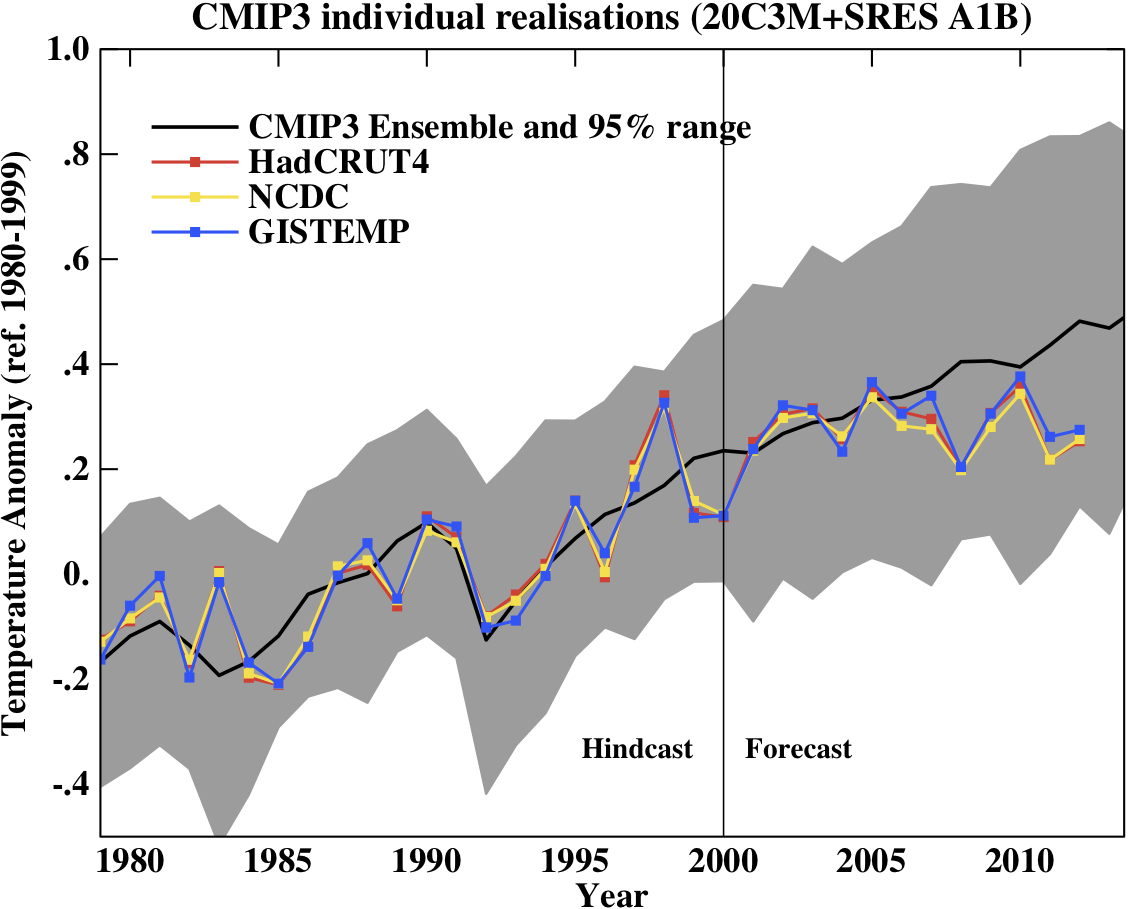 |
|
|
|
Post by steve on Apr 12, 2013 18:26:05 GMT
This is a version of a model-obs comparison based on the CMIP3 models that were run prior to the last IPCC assessment report: |
|
|
|
Post by sigurdur on Apr 12, 2013 22:51:08 GMT
Steve:
Thanks.
For any model, one would like to see how the hindcast compared to reality.
And the hindcast would have to go back to approx 0.O B.C.
|
|


