|
|
Post by magellan on Apr 13, 2013 0:11:42 GMT
Steve: Thanks. For any model, one would like to see how the hindcast compared to reality. And the hindcast would have to go back to approx 0.O B.C. They already knew the answer for the past. If they did it blindfolded only know two large volcanoes erupted, does anyone seriously believe it would come anywhere close? Yeah ok. Anyway, CMIP3 is just like any other model; wrong on so many things and tuned like a bad sounding piano. Note as well AR4 used HadCRUT3 as the gold standard, but regardless, why aren't they using the mean of the 3 temperature products? Like virtually all IPCC models, even the cherry picked CMIP3 is climbing up, up and away from reality. If a model is wrong on one major climate index, such as oceans, but still spits out the correct number, does that mean the model is correct? How about precipitation? Clouds? Solar radiation? See, it's all in how the modelers envision how the climate works. It isn't about "basic physics". The devil is in the details as they say. wattsupwiththat.com/2012/10/08/another-model-failure-seeing-a-sea-of-red-where-there-is-none/ |
|
|
|
Post by sigurdur on Apr 13, 2013 0:36:04 GMT
magellan:
The models have some validity. But that validity is only for training purposes and should never be used for planning/mitigation at this time.
Ya have to start somewhere and use the tools at hand. The only way one can figure out how screwed up they are, is to run them, observe results, and figure out what is wrong.
The "plug" factors are those unknowns and have to be adjusted at times. But as they are run more, output more, the "plug" factor should get smaller. The main thing is to gain knowledge, as you know.
But once again, they are most deffffffff not ready for "Prime Time". Anyone who claims that has an agenda and it is NOT based on scientific methods.
|
|
|
|
Post by magellan on Apr 13, 2013 1:06:28 GMT
magellan: The models have some validity. But that validity is only for training purposes and should never be used for planning/mitigation at this time. Ya have to start somewhere and use the tools at hand. The only way one can figure out how screwed up they are, is to run them, observe results, and figure out what is wrong. The "plug" factors are those unknowns and have to be adjusted at times. But as they are run more, output more, the "plug" factor should get smaller. The main thing is to gain knowledge, as you know. But once again, they are most deffffffff not ready for "Prime Time". Anyone who claims that has an agenda and it is NOT based on scientific methods. The vast majority of my reading about climate models was done at RPS. He has numerous posts on just how bad they really are. The dirty little secret is: pielkeclimatesci.wordpress.com/2009/01/20/comments-on-real-climates-post-faq-on-climate-models-part-ii/ I don't have experience with climate models, but do with FEA. I remember the first time we used it (probably 15 years ago and was ALGOR of all names), a simple machine ended up looking like a rocket launcher. It's a good thing my name wasn't attached to the design; my boss' took all the "credit". After they ran the job costs, he wasn't working there one year later. FEA is very useful, but too much trust can be placed in them even today. Sometimes common sense and good engineering knowledge must take precedence over a computer. |
|
|
|
Post by steve on Apr 13, 2013 15:38:56 GMT
Magellan, Don't really understand your point here. Your plot shows a warming of between 0.4C and 1.0C between the 1960s and 2013 (or thereabouts). HadCRUT3 had a warming of around 0.5C over this period - certainly at the lower end of the range, but not inconsistent according to the authors' expectations - which is what the argument is about here. |
|
|
|
Post by duwayne on Apr 13, 2013 17:12:51 GMT
This is a version of a model-obs comparison based on the CMIP3 models that were run prior to the last IPCC assessment report: 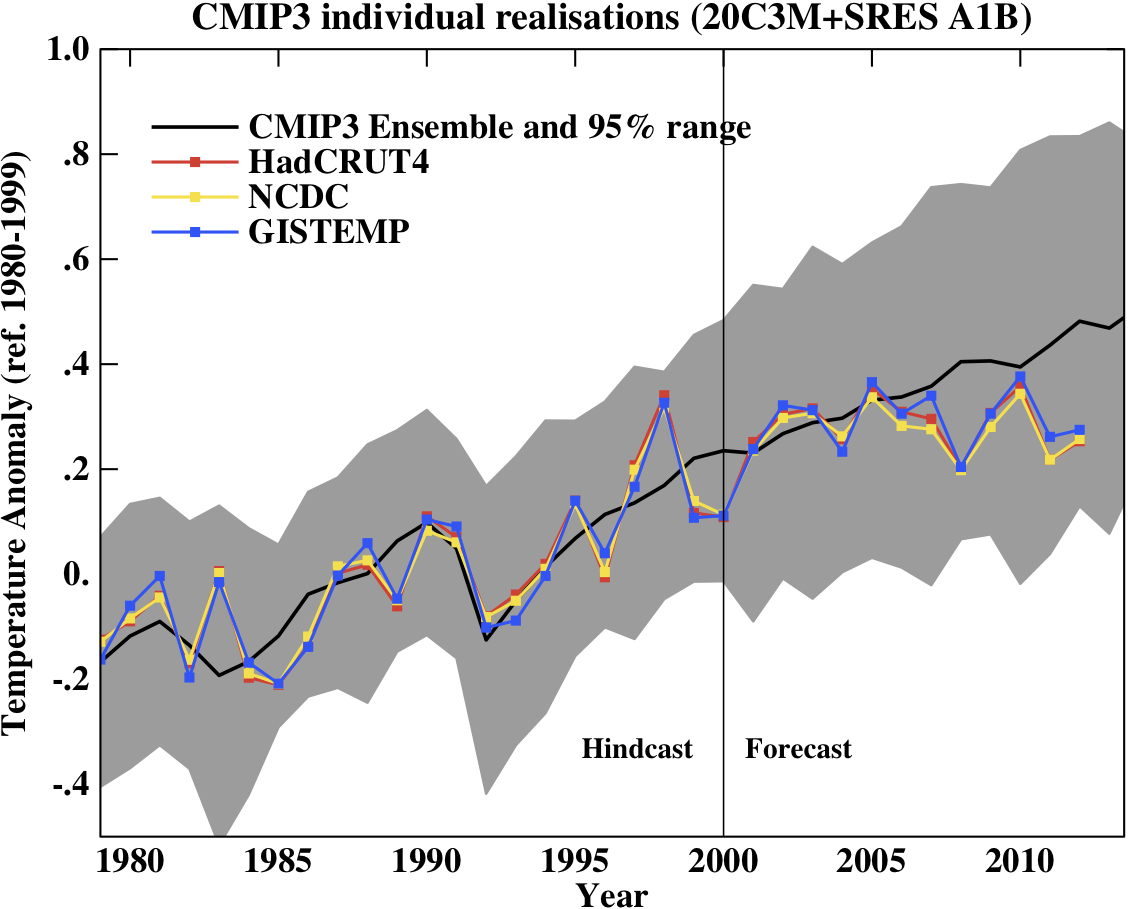 Steve, do you make your decision as to whether the IPCC central case is realistic based on the error bars on the chart you provided? If you are looking at a single month, the error bars may have some meaning. But do these error bars apply to the central case trend line? Or is the bottom of the error bar only meant to cover the situation where there is a short term (1 month) deflection from a lower growth scenario (reduced CO2 emission growth) trend because of a short term perturbation from a strong La Nina or a volcanic eruption or something similar? If all of the average annual observations are far below the predictions for severalyears when the solar cycle is near its peak, does that have more meaning than comparing to artificial error bars? Let me ask again. At the beginning of this thread you asked for predictions of global warming. What are your predictions or guesses for future global temperatures? Is it the IPCC central case? |
|
|
|
Post by steve on Apr 13, 2013 18:40:26 GMT
duwayne,
The realclimate expectation is for the annual means to stay within this grey area.
It's a judgement call really as to how well the models do based on what happens in the future.
If, say, SC25 is as strong as SC23, and a couple of medium to strong El Ninos occur in succession, and there are no big volcanoes, but the temperatures only return to the middle of the grey area, then I would accept that the models are running hot.
Predicting temperatures to remain in the grey area is not a very courageous prediction. Even at the colder end of the latest decadal forecast the temperatures could be within the grey area (it's hard to tell as the realclimate plot doesn't include that period).
My first guess on this board was based on the first Met Office forecast - which went OK for two of the three years. If I were to guess again, then, I'd go with the current Met Office forecast - next 3 years at or around the 1998 temperature.
|
|
|
|
Post by duwayne on Apr 15, 2013 18:35:35 GMT
duwayne, The realclimate expectation is for the annual means to stay within this grey area. It's a judgement call really as to how well the models do based on what happens in the future. If, say, SC25 is as strong as SC23, and a couple of medium to strong El Ninos occur in succession, and there are no big volcanoes, but the temperatures only return to the middle of the grey area, then I would accept that the models are running hot. Predicting temperatures to remain in the grey area is not a very courageous prediction. Even at the colder end of the latest decadal forecast the temperatures could be within the grey area (it's hard to tell as the realclimate plot doesn't include that period). My first guess on this board was based on the first Met Office forecast - which went OK for two of the three years. If I were to guess again, then, I'd go with the current Met Office forecast - next 3 years at or around the 1998 temperature. Steve, it's good to hear that your best guess is for relatively flat temperatures over the next few years. Do you have any more insight from the Met Office with respect to what specifically has changed with respect to their models? You still seem to be hanging on to some hope(?) that the climate modelers were right. I have trouble understanding this. Comparison with actual says they are wrong under any reasonable standard. It's obvious why they are wrong. The "plug factor" for aerosols is pure alchemy. Science plus alchemy equals alchemy. I don't know whether the realclimate site still supports the plug factors, but if so, I'd be interested in what their science-based arguments might be. And they are wrong because they close their eyes with respect to the natural Ocean Cycle and the substantial circumstantial evidence including the current multi-year run of flat temperatures. I've posted data on the PDO. I like the PDO because its reported monthly and it's detrended for global temperature growth which allows the cycle to be easily seen. But it's also possible to detrend the AMO data yourself and compare it to the detrended global temperatures. Look at the following chart referenced by "Edim" on Tallblokes blog. link I cannot believe that the climate modelers cannot pick up the correlation between global temperatures and the Ocean Cycle. |
|
|
|
Post by steve on Apr 15, 2013 21:44:29 GMT
duwayne, The realclimate expectation is for the annual means to stay within this grey area. It's a judgement call really as to how well the models do based on what happens in the future. If, say, SC25 is as strong as SC23, and a couple of medium to strong El Ninos occur in succession, and there are no big volcanoes, but the temperatures only return to the middle of the grey area, then I would accept that the models are running hot. Predicting temperatures to remain in the grey area is not a very courageous prediction. Even at the colder end of the latest decadal forecast the temperatures could be within the grey area (it's hard to tell as the realclimate plot doesn't include that period). My first guess on this board was based on the first Met Office forecast - which went OK for two of the three years. If I were to guess again, then, I'd go with the current Met Office forecast - next 3 years at or around the 1998 temperature. Steve, it's good to hear that your best guess is for relatively flat temperatures over the next few years. Do you have any more insight from the Met Office with respect to what specifically has changed with respect to their models? I have no special insight. If I were to guess I would assume that the more complex and higher resolution model can demonstrate natural variability more consistently. With the older model, the variability is averaged out across the ensemble members which results in the greenhouse gas signal dominating. If you look at the hindcasts, there is much more detail in them - they are a lot noisier. I'm not saying that the higher resolution model's consistency means they are more likely right though! I don't know why it is "good to hear" that my best guess is for not much warming. My best guess long term is not affected by short term trends. You are misunderstanding what the aerosol issue is about. They are estimated and used to assess the likely contribution of CO2 (versus other causes) to recent warming. Most of the problem with the aerosols is knowledge about the observations (knowing what the aerosols were) not knowledge about the model behaviour. So the detrended warming is related to the ocean state. So what? What we are interested in is the cause of the trend. Ocean cycles may control the red detrended line but they don't control the rise evident in the blue HadCRUT4 line:  |
|
|
|
Post by icefisher on Apr 16, 2013 5:42:49 GMT
So the detrended warming is related to the ocean state. So what? What we are interested in is the cause of the trend. Ocean cycles may control the red detrended line but they don't control the rise evident in the blue HadCRUT4 line: No the ocean state does not provide the rise evident in the blue HadCRUT4 line. Dr Syun Akasofu suggests that is a result of the recovery from the LIA. More than likely solar controlled. The nice thing about the solar argument is when you subtract out the ocean state warming of the 80's and 90's, you only need .5 deg/century warming. . . .only one sixth as much of trend declared to be needed when solar was initially rejected as too weak. (to clarify it doesn't need to account for a rate of 3 degrees/century.) But having two variables seems elevate the problem above the math abilities of your typical climate scientist/modeler. The ocean state warming from 1980 to 2005 provided about 6 tenths a degree warming in 25 years, accounting for 2.4 degrees per century. Throw a 1/2 degree per century on that and you get the 2.9deg/century warming trend breathlessly modeled by the IPCC into its alarmist document. Only problem is the ocean state did not continue to warm and is now cooling. Give it 10 years for the ocean state to pass the equilibrium point on the way back down and some global cooling should result. |
|
|
|
Post by steve on Apr 16, 2013 12:47:30 GMT
The ocean state is not cooling. Ocean heat content is rising, and the rise is validated by observed rises in sea level (which cannot be fully explained by other causes such as loss of land ice).
|
|
|
|
Post by trbixler on Apr 16, 2013 13:28:09 GMT
2005-2013 kind of flat to my eye.  "If we were to consider the “unadjusted” ocean heat content data (represented by the UKMO EN3 data in Figure 1) to be correct, then the ocean heat content for depths of 0-2000 meters flattened as soon as the ARGO floats had reasonably compete coverage of the global oceans in 2003-04. It’s only when the ocean heat content data is corrected, tweaked, adjusted, modified, whatever (represented by the NODC data in Figure 1), that the global ocean heat content continues to warm in relative agreement with climate models." link |
|
|
|
Post by duwayne on Apr 16, 2013 16:11:42 GMT
duwayne, The realclimate expectation is for the annual means to stay within this grey area. It's a judgement call really as to how well the models do based on what happens in the future. If, say, SC25 is as strong as SC23, and a couple of medium to strong El Ninos occur in succession, and there are no big volcanoes, but the temperatures only return to the middle of the grey area, then I would accept that the models are running hot. Predicting temperatures to remain in the grey area is not a very courageous prediction. Even at the colder end of the latest decadal forecast the temperatures could be within the grey area (it's hard to tell as the realclimate plot doesn't include that period). My first guess on this board was based on the first Met Office forecast - which went OK for two of the three years. If I were to guess again, then, I'd go with the current Met Office forecast - next 3 years at or around the 1998 temperature. Steve, it's good to hear that your best guess is for relatively flat temperatures over the next few years. Do you have any more insight from the Met Office with respect to what specifically has changed with respect to their models? You still seem to be hanging on to some hope(?) that the climate modelers were right. I have trouble understanding this. Comparison with actual says they are wrong under any reasonable standard. It's obvious why they are wrong. The "plug factor" for aerosols is pure alchemy. Science plus alchemy equals alchemy. I don't know whether the realclimate site still supports the plug factors, but if so, I'd be interested in what their science-based arguments might be. And they are wrong because they close their eyes with respect to the natural Ocean Cycle and the substantial circumstantial evidence including the current multi-year run of flat temperatures. I've posted data on the PDO. I like the PDO because its reported monthly and it's detrended for global temperature growth which allows the cycle to be easily seen. But it's also possible to detrend the AMO data yourself and compare it to the detrended global temperatures. Look at the following chart referenced by "Edim" on Tallblokes blog. linkI cannot believe that the climate modelers cannot pick up the correlation between global temperatures and the Ocean Cycle. Steve, it's apparent from what you've written here and in your past few posts that you don't understand what I am saying. Until you understand what I am saying (not necessarily agree with it) it is impossible to have a useful discussion. |
|
|
|
Post by duwayne on Apr 16, 2013 16:34:30 GMT
So the detrended warming is related to the ocean state. So what? What we are interested in is the cause of the trend. Ocean cycles may control the red detrended line but they don't control the rise evident in the blue HadCRUT4 line: No the ocean state does not provide the rise evident in the blue HadCRUT4 line. Dr Syun Akasofu suggests that is a result of the recovery from the LIA. More than likely solar controlled. The nice thing about the solar argument is when you subtract out the ocean state warming of the 80's and 90's, you only need .5 deg/century warming. . . .only one sixth as much of trend declared to be needed when solar was initially rejected as too weak. (to clarify it doesn't need to account for a rate of 3 degrees/century.) But having two variables seems elevate the problem above the math abilities of your typical climate scientist/modeler. The ocean state warming from 1980 to 2005 provided about 6 tenths a degree warming in 25 years, accounting for 2.4 degrees per century. Throw a 1/2 degree per century on that and you get the 2.9deg/century warming trend breathlessly modeled by the IPCC into its alarmist document. Only problem is the ocean state did not continue to warm and is now cooling. Give it 10 years for the ocean state to pass the equilibrium point on the way back down and some global cooling should result. Icefisher, in my opinion you've hit the key point with respect to the Ocean Cycle. Global temperatures are going to grow much slower than predicted by the IPCC models. Whether the overall mass of the ocean has cooled or not is open for discussion. But, either way, it doesn't change the slower global temperature growth conclusion and the greatly diminished role of CO2 in that warming. I've come to realize that Steve doesn't understand why we say this is true. |
|
|
|
Post by sigurdur on Apr 16, 2013 19:16:00 GMT
duwayne:
Thank you for the discussion via this thread.
I agree that Icefisher understands what you are talking about.
Steve provides hints that he does, but then backs away.
|
|
|
|
Post by icefisher on Apr 16, 2013 23:33:50 GMT
So the detrended warming is related to the ocean state. So what? What we are interested in is the cause of the trend. Ocean cycles may control the red detrended line but they don't control the rise evident in the blue HadCRUT4 line: The ocean state is not cooling. Ocean heat content is rising, and the rise is validated by observed rises in sea level (which cannot be fully explained by other causes such as loss of land ice). Uh Steve we are talking about your chart there, the green plot. Its clearly entered a cooling phase and it is pulling Hadcrut4 with it both the blue and red plots. It appears to have about 20 years to run if past histories are an indicator. Where do you get this sudden about face denial from? Climate model adjusted upper ocean heat? Its also the case that the underlying trend (the blue plot) without the ocean state is quite a bit less than one degree per century. |
|


