jopo
New Member

Posts: 30 
|
Post by jopo on Jul 6, 2018 10:32:04 GMT
I should mention that the QBO axis has been inverted.
|
|
jopo
New Member
Posts: 30
|
Post by jopo on Jul 6, 2018 9:21:19 GMT
|
|
jopo
New Member
Posts: 30
|
QBO
Jul 6, 2018 7:45:43 GMT
Post by jopo on Jul 6, 2018 7:45:43 GMT
www.daculaweather.com/4_qbo_index.phpAt the end of the above page, a table of monthly QBO values appears to show QBO intensity increasing over the last 50 odd years. Are these figures correct, why such a long gain in values?? I recently come across a abstract written at the 40th COSPAR Scientific Assembly in 2014 adsabs.harvard.edu/abs/2014cosp...40E2732RQuasi-Biennial Oscillation as the Result of Planetary Motion QUASI-BIENNIAL OSCILLATION AS THE RESULT OF PLANETARY MOTION A.Ju.Retejum Lomonosov Moscow State University, aretejum@yandex.ru A remarkable phenomenon of quasi-biennial oscillation (QBO) attracts a growing attention for its unclear origin and possible global impact. A comprehensive theory of this phenomenon should answer the following questions: 1. Why does the phase change of the atmospheric circulation on average occur every 800 days? 2. When does the cycle length decreases or increases? 3. Wherefore the regular wind shift is observed in the equatorial stratosphere only? 4. What could cause a sudden reverse in zonal wind direction? 5. Why the generating impulse travels from the border between the atmosphere and outer space downwards without significant loss of power? 6. What is the reason of known differences in behavior patterns between west and east winds? 7. How do middle and upper latitudes respond to the remote signal? Unfortunately all the explanation of QBO that have been given so far, unable to meet the above criteria. The author proposes an alternative idea of the external forcing due to motion of Mars, Jupiter and Venus. This study is based on the QBO Index data at the 30-hPa Height for the 1979-2013 period (http://www.cpc.ncep.noaa.gov/data/indices/qbo.u30.index). Having in mind that the oscillation is symmetric about the Equator, where the Earth rotation speed is highest, one examined on the first stage relationships between the QBO manifestation and the length of day. A ten-year comparison of slow and fast spinning periods (1979-1983, 1991-1995 and 2000-2006, 2009-2011 respectively) reveals a significant difference in west and east winds strengths. The same picture can be observed if mean monthly data for March-April (the length of day maximum) and July (the length of day minimum) are collated. This is the answer to the question # 3. The exact answers to questions # 1 and # 2 give an analysis of the dependence of the wind reverse time on the moments of Mars, Jupiter and Venus conjunctions or opposition in geocentric ecliptical longitudes. Mars having the synodic period varies between 764 and 810 days plays a key role in this process of external regulation. The planets forcing fact is the answer to the question # 5. Sudden reverses in zonal wind direction coincide with the Earth’s changing rotation rate under the influence of other planets and the Sun. Winds shift to west usually occurs when the length of day is getting longer, and the globe’s spin-up produces an opposite effect. West and east winds exhibit different response to the forced irregularities of the forward rotation of the Earth. This finding helps answer to questions # 4 and # 6. Some signs of quasi-biennial modulation in northern regions might be considered as traces of the telecommunication factor. But processing of the data on sensitive indicators (zonal winds and heat flux at 60° as well as total ozone concentration) by means of the superposed epoch method provide evidences of the Martian control (the answer to questions # 7). The first proven effect of the planets impact on the Earth’s atmosphere is a result of conservation of angular momentum in the Solar system and interaction of the outer ether envelops of celestial bodies with forward and reverse rotation. So i downloaded the ephemeris XYZ data from the NASA Horizons site. The resultant angle when using Jupiter (J) Mars (M) and Earth (E) returned the chart below. Not bad. I tried Venus in the mix and again a simialr result. But always noisy. Something in it I say. I suspect correlation is actually better around the zero crossovers for plantary geometric events. I am yet to figure how to extract that from the ephemeris. Unable to load the 98KB attachement to this post??? |
|
jopo
New Member
Posts: 30
|
Post by jopo on Apr 6, 2018 23:54:43 GMT
Really like the work these guys do. (suspicious0bservers) They have sold me on the space / earth electro connection Been watching there stuff for a few years now. Then he was getting flack for his supposed crackpot theories. He has been vindicated now as NASA and others are jumping on board. Even citing one of his papers in their own findings |
|
jopo
New Member
Posts: 30
|
Post by jopo on Mar 31, 2018 3:17:40 GMT
I know one may wonder why this wayward Chinese satellite coming at earth is not in another thread from this site. Bare with me please. The European Space Agency (ESA) have actually put in writing what many have observed for a long time. It is just not spelled out as clearly as it is has been this time in their update! My take home from this So here is my assessment of the key points where ESA state in their "UPDATE 30" regarding the satellites re-entry into earths orbit. re: the following; - Today’s new forecast is a noticeable change from that of yesterday, and is due to solar activity.
- A high-speed stream of particles from the Sun, which was expected to reach Earth and influence our planet’s geomagnetic field,
- This means that the density of the upper atmosphere, through which Tiangong-1 is moving, did not increase as predicted
So the take home message here from the ESA is that the SUN plays with Earths magnetic field! And Earths magnetic field dictates the level of density on our atmosphere. Is that a fair assumption fella's or have I got it wrong? blogs.esa.int/rocketscience/2018/03/26/tiangong-1-reentry-updates/
.......... Update 30 March 2018
The current estimated reentry window runs from the night of 31 March to the late evening of 1 April (in UTC time); this is highly variable.
Today’s new forecast is a noticeable change from that of yesterday, and is due to solar activity.
One of the main reasons why it is so difficult to make an accurate reentry predictions, even if just a few days in advance of an expected reentry, materialised during the last 24 hours.
A high-speed stream of particles from the Sun, which was expected to reach Earth and influence our planet’s geomagnetic field, did, in fact, not have any effect, and calmer space weather around Earth and its atmosphere is now expected in the coming days.
This means that the density of the upper atmosphere, through which Tiangong-1 is moving, did not increase as predicted (which would have dragged the spacecraft down sooner) and hence the ESA Space Debris Office has adjusted the predicted decay rate.
This implies that the new (and still uncertain) reentry window has shifted to later in the day on 1 April.
Reentry will take place anywhere between 43ºN and 43ºS (see map here). Areas above or below these latitudes can be excluded. At no time will a precise time/location prediction from ESA be possible. This forecast was updated approximately weekly through to mid-March, and is now being updated every day.
|
|
jopo
New Member
Posts: 30
|
Post by jopo on Mar 29, 2018 8:30:30 GMT
Nice find Blustnmtn. Hope you don't mind I will use your find on another OZ thread. Please excuse my ignorance here. unsure on the protocol for this site regarding this. hope it is ok? |
|
jopo
New Member
Posts: 30
|
Post by jopo on Feb 19, 2018 15:57:40 GMT
Big paper out by NASA and others NASA are really coming on board with the sun and other global precursors to earthquakes. There paper through references to other papers are a game changer. many of these papers and similar have been ridiculed over the years. www.scirp.org/journal/PaperInformation.aspx?paperID=82421#ref336. Conclusions The Kp index for the times of earthquakes between 1932-2016 was statistically analyzed. Stacking of thousands of Kp data shows an effect of the geomagnetic field on earthquakes triggering. As described in Analysis Summary, a distinct pattern of the Kp fluctuations prior to earthquakes was found, indicating the synchronization of geomagnetic surges and seismicity. These synchronizations are quite complex, reflecting the regional characteristics and the earthquake magnitude itself. M8 class earthquakes are associated with the Kp surge more than M6 class ones. The geomagnetic disturbance, typically the magnetic storm, is one of the major factors which synchronize with earthquakes. This study offers a scientific support to the past numerous researches by the predecessors and the current researchers. 5. Review of Historical StudiesAristotle, the Greek philosopher, described that earthquakes occur more frequently during the night than during the day [4] . Starting at the beginning of the 20th century, studies were performed to determine whether the time sequences of earthquakes follow any systematic pattern. After many studies it became evident that the seismicity exhibits distinct diurnal as well as seasonal cycles in many different earthquake zones [5] - [13] .Such cycles of seismic activity can only be attributed to solar influence. Consequently, studies were done to model such solar-terrestrial effects. The powerful electric current vortices in the ionosphere, generated by solar radiation, and the associated magnetic field variations are assumed to be the essential source for the effect. Due to the penetration of those magnetic field variations into the electrically conductive Earth’s lithosphere, and associated electric “telluric” currents, additional mechanical forces are generated in seismic rupture zones [14] [15] [16] . Another observation that supports the theory of solar influence is the clustering of earthquakes in 11-year cycles in accordance with the solar cycles [17] - [23] .In this overall context, several recent studies focused on the cycles of the solar polar magnetic field, which manifest themselves in solar flare activity. A high degree of statistical significance was shown for a correlation of those polar field oscillations and the occurrence of strong earthquakes [24] [25] . Similarly, it has been stated that, during the Maunder solar minima, the strongest earthquakes and most violent volcanic eruptions took place during transition phases of the heliospheric magnetic field [26] .Other studies deal with the question of whether geomagnetic storms play a role in the triggering of earthquakes. These magnetic storms are generated by a sudden surge in the intensities of the solar wind (plasma) streams, which originate on the sun’s surface and travel with high speed toward our planet. Disturbances of the geomagnetic field caused by this solar influence are classified by the so-called 3-hour Kp Index [27] . Several papers confirm this Kp index to be an appropriate indicator for the solar influence, including magnetic storms, on seismicity [28] [29] [30] [31] [32] .However, another investigation claims to have demonstrated no statistical significance for any solar-terrestrial triggering of earthquakes [33] . |
|
jopo
New Member
Posts: 30
|
Post by jopo on Nov 13, 2017 14:37:59 GMT
These guys are great. Check out this video. NASA are finally catching up with the daredevils. Using the electric universe and the electric earth to predict earthquakes Video goes for 18 minutes. Bit of chit for the first two minutesd then gets into it. The NASA paper verifies all Ben states in his video. arxiv.org/ftp/arxiv/papers/1711/1711.01780.pdf |
|
jopo
New Member
Posts: 30
|
Post by jopo on Nov 4, 2017 13:10:44 GMT
My observations have been that TLT Satellite data lags surface data when in the monthly format by about 2 months
|
|
jopo
New Member
Posts: 30
|
Post by jopo on Oct 20, 2017 8:40:38 GMT
Love the way this crew operate.
Always gathering the data and putting forward.
Empirical evidence with Geomagnetic activity and hurricanes.
Peer reviewed papers as well. Why argue it!
|
|
jopo
New Member
Posts: 30
|
Post by jopo on Oct 18, 2017 10:25:42 GMT
|
|
jopo
New Member
Posts: 30
|
Post by jopo on Oct 17, 2017 14:07:53 GMT
|
|
jopo
New Member
Posts: 30
|
Post by jopo on Oct 17, 2017 13:49:34 GMT
I have no problems in taking this serious. There is a paper i have read on seismic activity and Global temperatures some time ago. Not sure if you guys have put this up prviously? Seismic activity was used as a proxy for geothermal flux www.omicsonline.org/open-access/the-correlation-of-seismic-activity-and-recent-global-warming-2157-7617-1000345.pdfAbstract
The latest report from the Intergovernmental Panel on Climate Change states with high confidence that the warming of global temperatures since 1901 has been driven by increased radiative forcing. The gases responsible for this enhanced forcing are greenhouse gases of anthropogenic origin, and include carbon dioxide, methane, and halocarbons. The Nongovernmental International Panel on Climate Change has challenged these findings and concludes that the forcing from greenhouse gases is minimal and diminishing. They add that modelling attempts of past and future climate states are inaccurate and do not incorporate important solar inputs, such as magnetic strength and total irradiance. One geophysical variable that has been overlooked by both groups is geothermal flux. This study will show that increasing seismic activity for the globe’s high geothermal flux areas (HGFA), an indicator of increasing geothermal forcing, is highly correlated with average global temperatures from 1979 to 2015 (r = 0.785). By comparison, the correlation between carbon dioxide loading and global temperatures for the same period is lower (r = 0.739). Multiple regression indicates that HGFA seismicity is a significant predictor of global temperatures (P < 0.05), but carbon dioxide concentrations do not significantly improve the explained variance (P > 0.1). A compelling case for geothermal forcing lies in the fact that 1) geothermal heat can trigger thermobaric convection and strengthen oceanic overturning, important mechanisms for transferring ocean heat to the overlying atmosphere, and 2) seismic activity is the leading indicator, while global temperature is the laggard.
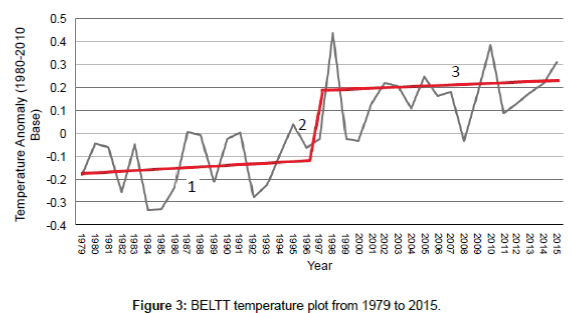
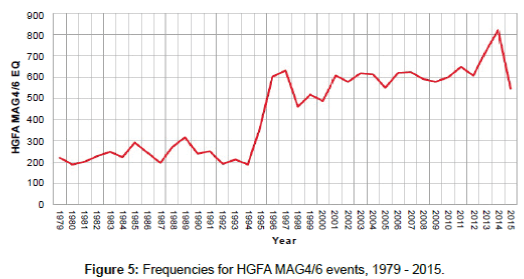
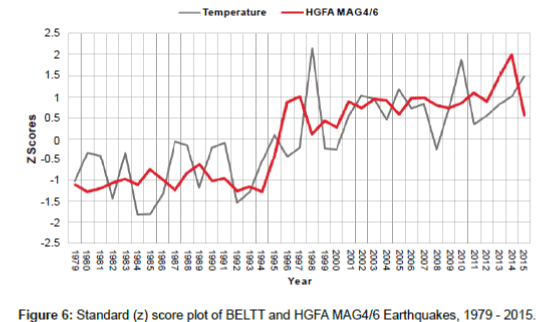
Conclusion
Earth’s climate is a remarkably “noisy” system, driven by scores of oscillators, feedback mechanisms, and radiative forcings. Amidst all this noise, identifying a solitary input to the system (i.e., HGFA MAG4/6 seismic activity as a proxy for geothermal heat flux) that explains 62% of the variation in the earth’s surface temperature is a significant finding. Additionally, the 1997/1998 SIENA was a strong signal for subsequent global warming, and this type of seismic jump may provide valuable predictive information. Conversely, if seismic activity gaps downward, this may indicate the onset of a cooling period. Future research clearly needs to incorporate seismic and geothermal inputs into global climate models. The climate community should also begin to explore the impacts of geothermal flux on poorly understood feedbacks, such as Antarctic glacial retreat [40], water vapor, clouds, and the release of methyl hydrates [41].
To ameliorate the problems of rising global temperatures, legislative and taxing initiatives are currently being proposed and evaluated by governing bodies around the world. Most of these initiatives are designed to curb GHG emissions. However, this study shows that we may want to delay such actions until all of the climate system’s inputs are fully accounted for.
|
|
jopo
New Member
Posts: 30
|
Post by jopo on Oct 15, 2017 10:41:13 GMT
|
|
jopo
New Member
Posts: 30
|
Post by jopo on Oct 15, 2017 2:24:47 GMT
Another take on it is Volcanic activity? And hello to everyone. I enjoy this site you guys have. Cheers  |
|


