|
|
Post by lsvalgaard on Jul 2, 2010 7:06:32 GMT
For an unbiased sample you do not need to measure every day, as long as your selection criteria does not depend on anything you measure. This simple statistical truth seems to escape you, yet is used in any and all polls. What seems to be escaping you is that measuring everything is better than random selection. But we do need to remember things are different in your universe  The L&P method will eventually show the same trend, but its bit mind numbing waiting for the obvious result. Except you do not use everything as you only retain the highest value for each group. This is deliberate bias, but is understandable considering your reason for the bias. |
|
|
|
Post by lsvalgaard on Jul 2, 2010 5:27:51 GMT
Every day I measure the height of the children on our local school bus and only record the tallest one. Thus I bias the record against the taller end of the distribution. Or it would be like proving global warming by only recording the highest temperature each year. Your problem is that you do not measure every day. For an unbiased sample you do not need to measure every day, as long as your selection criteria does not depend on anything you measure. This simple statistical truth seems to escape you, yet is used in any and all polls. |
|
|
|
Post by lsvalgaard on Jul 1, 2010 13:21:24 GMT
"Only the peak measurements are recorded thus removing any bias"Well, that introduces the bias right there. F10.7 is the true indicator of SC24 [and any other cycle]. No bias, all days are measured with the highest reading for that group making the record. Much better than random selection. I see todays reading at 82%, a new SC24 record. Every day I measure the height of the children on our local school bus and only record the tallest one. Thus I bias the record against the taller end of the distribution. Or it would be like proving global warming by only recording the highest temperature each year. |
|
|
|
Post by lsvalgaard on Jul 1, 2010 5:26:52 GMT
You don't have an understanding of how the measurements are taken, all 6 were included. It is explained clearly on the website. Basically the whole region is measured including any specks that might be included for any region that exceeds 23 pixels in total. Only the peak measurements are recorded thus removing any bias. This is a true indication of the magnetic strength of SC24. Well, that introduces the bias right there. F10.7 is the true indicator of SC24 [and any other cycle]. |
|
|
|
Post by lsvalgaard on Jun 30, 2010 15:47:42 GMT
This graph says it all..all cycle 24 spots are included. I don't think so. E.g. on howard.astro.ucla.edu/pub/obs/drawings/dr100602.jpg there were six spots. You say all six were included? Or only the biggest and darkest one? above the threshold? Thus making a biased selection. |
|
|
|
Post by lsvalgaard on Jun 30, 2010 10:18:29 GMT
It is misleading to claim that Maunder minimum was result of L & P type effect, unless it can be shown that it is mainly active in one hemisphere. During the Maunder minimum all the activity was in the southern hemisphere, Thus the Maunder Minimum could simply show that L&P was indeed active in one hemisphere. More likely, there was an asymmetry in the dynamo. Something that dynamo models often predict, and something we see regularly: 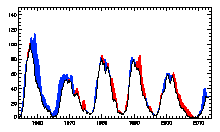 |
|
|
|
Post by lsvalgaard on Jun 29, 2010 18:47:31 GMT
Leif writes "it is reported that all the spots seen during the Maunder Minimum were large spots." I am interested in the history of solar physics. I have read The Sun Kings by Stuart Clarke, Edward Maunder's papers on the Maunder minimum, and the reports of Jack Eddy. I dont remember anyone mentioning that the spots observed during the Maunder minimum were large. Can you give me a clue as to where this was reported, please? Just about every observer comments on this. I have not seen any saying "today I saw a tiny spot on the Sun". Without going to the original sources, you can find some quotes in Soon's book ISBN 981-238-275-5, Ee.g. "not only were the spots big or in groups, but they often hung onto the sun for longer periods of time" page 41. We know from modern observations that long-lived spots are big. Now ALL is a very absolute word, and it is, of course, likely that the larger the spot the larger the probability that it would be reported. In modern times, big spots have some little hangers-on and they probably had that too in the 17th century. |
|
|
|
Post by lsvalgaard on Jun 29, 2010 17:25:02 GMT
I am no expert, but it looks like the magnetic signature of 1084 is from SC 23/25. Is this true, and if so, does it matter? It cannot be from SC25. But no need to speculate too much. 1084 is a still-surviving early spot that had shown some rotation and has not just rotated a bit more. So it is a SC24 that has twisted itself around. This happens from time to time. |
|
|
|
Post by lsvalgaard on Jun 29, 2010 16:05:14 GMT
Dr. S...Did L&P measure 1082 & 1084 at their peak? 2 dark regions that should be added to the data set? I don't know yet. I should get the measurements for June later this week. Adding regions based on their characteristics is bad science [biased selection]. In any case L&P is not about the darkest spots. Even if the dark spots show no change [otherwise they would not be so dark] it is enough that the smaller spots do for the effect to be important. BTW, it is reported that all the spots seen during the Maunder Minimum were large spots. |
|
|
|
Post by lsvalgaard on Jun 28, 2010 15:09:28 GMT
What do you mean by a credible trend?
Data are not a matter of belief. That is precisely a problem with L & P. It appears that some people's belief in this effect is unquestionable despite of no evidence either of physics mechanism or significant statistical trend. Data do not need a physics mechanism to be valid. The physics will come in time. I am sorry, but after over forty years of evaluating data ( in particle physics but data are data) I can assure you that the trend that the plot shows is statistically significant. If you believe that the data are wrongly measured, do write up your paper with the proofs . Statements and wishful hand waving does not fit the bill. By itself, L&P might be a temporary fluke [but the data as far as they go are OK, because they are precise measurements by an experienced and renowned observer]. There are three reasons I believe L&P is important and [as good science] is telling us something about the Sun: 1) The L&P data themselves 2) The increasing discrepancy between the sunspot number and the F10.7 flux since ~1990 3) The existence of significant cosmic ray modulation during the Maunder [and other Grand Minima] even though few spots were seen. L&P provides an explanation for 2) and 3). If we discount L&P then we have three puzzles rather than one. For this reason, L&P is a good working hypothesis and commands attention. Time will tell if we can turn the hypothesis into a theory backed up with a mechanism, in which case we have learned something important about the Sun. Giving up the possibility of learning something is bad science. Some of the resistance comes from people with an agenda, which cannot accommodate the possibility that the sunspot number may not be a valid measure for solar activity at all times. That kind of resistance can be dismissed out of hand. |
|
|
|
Post by lsvalgaard on Jun 28, 2010 6:36:52 GMT
This is nonsense. For instance, we don't measure the sunspot number on the backside of the Sun, so since not every spot is measured, by your 'logic' we cannot take the sunspot number [or the Layman's count for that matter] seriously. Just measuring every visible spot would be a good start, until this is done the method remains questionable. It is not feasible [telescope time] and there is nothing questionable in the method of unbiased sampling. www.northstarmath.com/sitemap/UnbiasedSample.htmlYou do not seem to have a grasp of elementary statistical sampling theory. You can learn more here: northeastipm.org/saremod/sampling.pdf |
|
|
|
Post by lsvalgaard on Jun 27, 2010 16:51:50 GMT
A good spot is coming around. Lets hope L&P get a measurement. Hoping is hardly scientific...we have already had spots recently that have been very dark. Every spot needs to be measured, otherwise we cannot take this study seriously. This is nonsense. For instance, we don't measure the sunspot number on the backside of the Sun, so since not every spot is measured, by your 'logic' we cannot take the sunspot number [or the Layman's count for that matter] seriously. |
|
|
|
Post by lsvalgaard on Jun 25, 2010 14:07:48 GMT
Dr S, How much Sun's energy is emitted and reflected by Earth back to space? Thanks. All of it. The reflected part is about a third of the whole. This part doesn't heat the surface. |
|
|
|
Post by lsvalgaard on Jun 21, 2010 5:56:19 GMT
Geoff admits that " the underlying magnetic area at this stage not looking overly strong", so just another example of a weakling. I would imagine he is referring to the area not the magnetic strength which is showing to be strong. Where do you get that idea from? 'showing to be strong'? numbers? showing where? MWO measured values around 2200 Gauss: howard.astro.ucla.edu/pub/obs/drawings/dr100620.jpg(you need to copy/paste the URL) |
|
|
|
Post by lsvalgaard on Jun 20, 2010 18:54:33 GMT
New sunspot (1084) measuring an incredible 80% on the Layman's darkness ratio. I hope L&P are measuring? Geoff admits that " the underlying magnetic area at this stage not looking overly strong", so just another example of a weakling. |
|


