|
|
Post by thermostat on Sept 13, 2011 2:12:40 GMT
Astroposer, Since you have introduced models into the discussion, here is a more quantitative alternative Since you have introduced models into the discussion, here is a more quantitative alternative So you introduce.....a model. When was the last time it was validated? Magellan, Schweiger, A., R. Lindsay, J. Zhang, M. Steele, H. Stern, Uncertainty in modeled arctic sea ice volume, J. Geophys. Res., doi:10.1029/2011JC007084, accepted, 2011 psc.apl.washington.edu/wordpress/wp-content/uploads/schweiger/pubs/IceVolume-2011-06-02-accepted-with-figures.pdfsee also, psc.apl.washington.edu/wordpress/research/projects/arctic-sea-ice-volume-anomaly/validation/In the interst of balance, Astroposer, could you provide the validation for PIPS 2.0 ? |
|
|
|
Post by thermostat on Sept 13, 2011 1:33:26 GMT
"I see that you now repeat your assertion that ice thickness was less in 2008 that 2011 based on NSIDC data. What is that data? (see also my previous post)."As a Magellen disciple, I am compelled to make an offering. It would certainly appear that 2008 had much less thick ice at the apex of the melt season. Astroposer, Since you have introduced models into the discussion, here is a more quantitative alternative  |
|
|
|
Post by thermostat on Sept 12, 2011 20:23:41 GMT
icefisher,You wrote, "Through the entire instrument record (to borrow an approach) never was there more than 2 years to a new record low ice level!"
This graph shows the annual sea ice extent minimum as determined by University of Bremen using AMSR-E data;
There a multiple examples where an new low extent minimum lasted for more than 2 years before being surpassed. (Actually, after 1974 there is only one case where a low was surpassed in 2 years.)
Ah! Impetuous youth! You have to love it! Tstat Milke and Heygster, 2009 is a modeling simulation. I said instrument record! Models do not qualify as instrumentation! icefisher, You are grasping at straws. This is the instrument data. All of the various groups that analyze sea ice data use related algorithms to process the raw instrument data. Take a look at the paper for yourself cross.physik.uni-bremen.de/iuppage/psa/documents/Technischer_Bericht_Milke_2009.pdf |
|
|
|
Post by thermostat on Sept 12, 2011 19:24:46 GMT
Projecting forward it is useful to consider the historical phenomenon of arctic amplification. Observations of the melting of continental ice sheets in interglacial periods are useful in understanding feedback mechanisms that increase melting. These phenomena are being observed today.Seems to me Tstat you read too many press releases. Through the entire instrument record (to borrow an approach) never was there more than 2 years to a new record low ice level! Now it is 4 years and counting. Seems to me feedback must have gone net negative. Getting to know you Tstat I suspect you have no response to that other than some vague reference to the general liturchur! The mechanism for the negative feedback may be the stripping of insulating ice off the coldest reaches of the arctic ocean. This may be pumping a huge infusion of cold salty water to the bottom of the ocean leading to La Ninas which lead to cooling and less ice melt. If the mean time for these currents traveling to the equator from the arctic is about 30 years all is copacetic. It is estimated some of these deep inter-ocean currents may require a thousand years. For the young folks in this forum like Tstat this could be educational. There may well be positive feedbacks in the ice melt field. But experience will eventually teach us that in complicated dynamic systems usually not just one feedback mechanism is in place and it almost always is a mistake to allow youthful naivete to grab the reins and reach immature conclusions about the system from extrapolations. Dynamic systems require a great deal of knowledge about the full range of responses before reliable predictions can be made. We see this in modeling for example fish populations. Life history characteristic of fish populations are complex and dynamic and almost all young exuberant scientists entering the field make huge mistakes jumping on to modeled extrapolations on how fish will reproduce and recruit into fisheries. In this field peer review and especially experienced scientists that have been around the barn more than one time play huge roles in schooling new scientists fresh from the university with bigger and better tools their forerunners had. Unfortunately climate science does not have such experience to draw upon. So it will be like it was in fishery science where in the early days must about every stock assessment missed the mark we will be going through that in climate science. Al Gore's theory we will only get one shot at this before we make ourselves go extinct is almost assurdedly as nutty as any reformed alcoholic standing on a soapbox in Pershing Square preaching impending doom. Of course we should learn about this stuff but a little less drama in the long run will probably be better for climate science as it could avoid getting stigmatized as lunatic science. Signs of that are already appearing. I noticed that when Obama defended climate science he didn't mention the "climate" he said the majority of people want to know what the "weather" is going to be like. icefisher, You wrote, "Through the entire instrument record (to borrow an approach) never was there more than 2 years to a new record low ice level!" This graph shows the annual sea ice extent minimum as determined by University of Bremen using AMSR-E data;  There a multiple examples where an new low extent minimum lasted for more than 2 years before being surpassed. (Actually, after 1974 there is only one case where a low was surpassed in 2 years.) By the way, Bremen is calling 2011 a new record minimum "Arctic sea ice extent small as never before" see the press release... www.iup.uni-bremen.de/seaice/amsr/"Alerting message from the Arctic: The extent the the Arctic sea ice has reached on Sep. 8 with 4.240 million km2 a new historic minimum (Figure 1). Physicists of the University of Bremen now confirm the apprehension existing since July 2011 that the ice melt in the Arctic could further proceed and even exceed the previous historic minimum of 2007. It seems to be clear that this is a further consequence of the man-made global warming with global consequences. Directly, the livehood of small animals, algae, fishes and mammals like polar bears and seals is more and more reduced." |
|
|
|
Post by thermostat on Sept 12, 2011 16:56:14 GMT
Hatter777, PIOMAS? Huh! fyi, Magellan himself has specifically requested that everyone on this forum ignor PIOMAS. Misrepresenting people again? I simply asked since PIOMAS is modeled, when was the last time it was validated? Cryosat2 was said to be the 'last word' on ice thickness, so what does its data show? NSIDC shows ice thickness gaining since 2008. Commonsense said I was wrong, so it should be easy to refute that. I also asked what should we be looking for to support the notion of a "death spiral" of Arctic ice? Ocean temperature? OHC? AO? AMO? NAO? Air temperature? The price of tea in China? Quoting Mark Serreze and other climate 'Gene Dixon' types is no longer interesting. I'd like to know what are the more long term indicators, say 5 years out. Surely there must be something. Magellan, See my previous post for the comment I was referring to when I said you requested that forum members not refer to PIOMAS. I see that you now repeat your assertion that ice thickness was less in 2008 that 2011 based on NSIDC data. What is that data? (see also my previous post). Then you ask again, " what should we be looking for to support the notion of a "death spiral" of Arctic ice? Ocean temperature? OHC? AO? AMO? NAO? Air temperature? The price of tea in China?" I would not focus on notions but rather would look at evidence. The condition of the Arctic Sea Ice over time indicates that sea ice is in decline; www.nsidc.org/images/arcticseaicenews/20110906_Figure3.png for example. The loss of multi-year ice that you site above is another indicator of this decline. Yes, Arctic Sea temperatures are important; they are increasing. See the present temperature anomoly here; polar.ncep.noaa.gov/sst/ophi/color_anomaly_NPS_ophi0.pngAir temperature in the Arctic are also increasing but this is most pronounced in the autumn and winter when the increased expanse of open water releases the ocean heat and warms the atmosphere. Related observations are the melting of montain glaciers and the Greenland Ice sheet. These are useful long term indicators. Projecting forward it is useful to consider the historical phenomenon of arctic amplification. Observations of the melting of continental ice sheets in interglacial periods are useful in understanding feedback mechanisms that increase melting. These phenomena are being observed today. |
|
|
|
Post by thermostat on Sept 12, 2011 16:29:31 GMT
Simply because you are wrong. Ice thickness has been decreasing. 2011 set a new record for low ice volume. Soot is NOT an explanation. natural variation is NOT an explanation. All that is just clinging at straws while trying to ignore the truth. Link? And please, no PIOMAS. BTW, which truth is that? I'm not seeing the death spiral not even from NSIDC, could you point it out?  Magellan, This is the post where you requested that people not cite PIOMAS. You also assert that ice thickness was thicker in 2008 that 2011. I later challenged that assetion and you did not respond. Let me repeat my objection (without referring to PIOMAS): "I presume that by 'the data' you are referring to the graphic on sea ice age from NSIDC which you posted just before. While sea ice age positively correlates with thickness, this graphic by itself does not automatically lead to the conclusion that sea ice overall is thicker since 2008. For example, the resolution of the graph only goes as far as >2 year (Historically their was a lot on 4, 5, and 5+ year old ice that was very thick) The actual concentration of the multiyear ice in regions of mixed age is also a factor to consider. That information is not provided by this graph. Various on site measurements throughout the Arctic Sea provide direct evidence of reduced thickness. See for example the information from the German Research Polarstern, translated from the German here; neven1.typepad.com/blog/2011/09/more-on-ice-thickness-from-awi.htmlThe Polarstern found that the ice at the North Pole was only 0.9 meters thick this summer. " Is there some other source you have that indicates that ice thickness was greater in 2011 than back in 2008? |
|
|
|
Post by thermostat on Sept 12, 2011 4:16:39 GMT
Hatter777, Piomas? Huh! fyi, Magellan himself has specifically requested that everyone on this forum ignor PIOMAS. Sorry, I missed that, and I hardly think that Magellen would tell anyone to dismiss a data source. With all due respect to Magellen, why would you think that any other forum members would follow his lead. After all most of us are deniers and skeptics, and right or wrong, we form our own ideas about things. Well this is a question for Magellan. I gather that he has disciples who do his bidding. |
|
|
|
Post by thermostat on Sept 12, 2011 3:58:04 GMT
Got it; yet another mindless wonder. Thanks for the insight. Ahh...missed opportunities. You could easily provide this chart to bolster your undefined position. 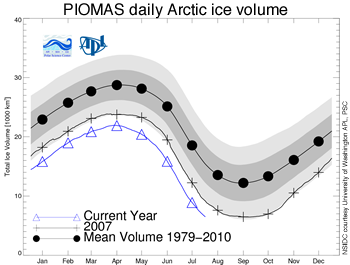 I understand that making a real attempt at discussion requires some effort, and that many lack the time to do so. Hatter777, PIOMAS? Huh! fyi, Magellan himself has specifically requested that everyone on this forum ignor PIOMAS. |
|
|
|
Post by thermostat on Sept 12, 2011 3:38:11 GMT
Hatter777 "chart I posted" Special glasses required? what chart you posted? LOL!.... As expected. Got it; yet another mindless wonder. Thanks for the insight. |
|
|
|
Post by thermostat on Sept 12, 2011 3:25:32 GMT
Hatter777, The volume lost is a key question. Right now, it is not clear. Nevertheless, it appears that present Arctic Sea Ice volume is lower than 2007. Huh! Perhaps you would like another mushroom, or the special glasses. The chart I posted in no way shows 11 below 07, but if you have a more recent one in mind which shows that, I would love to see it. Hatter777 "chart I posted" Special glasses required? what chart you posted? |
|
|
|
Post by thermostat on Sept 12, 2011 2:54:43 GMT
icefisher,I can begin to understand how your imagination works. What I question is whether you understand the first thing about how scientific research works.
Who is talking about scientific research? I am talking about government funding of scientific research. And I am very familiar how that works. icefisher, Agreed. You got me there. That's beyond politics and ideology. |
|
|
|
Post by thermostat on Sept 12, 2011 2:50:42 GMT
Astroposer, You are fabricating and imaginging and speculating on all sorts of mechanistic elements that you don't justify or understand. Some might interpret this as you intellectually flailing about. You asked me to explain why 2011 vs 2007 matters. Briefly, 2007 in the Arctic is understood as the result of a convergence of an unusual and unlikely combination of factors (a one in 20 probability event). This year we measure similar results when the unusual drivers are not present. We conclude that fundamental aspects of the system have changed. The results are quite similar, unless you factor in the fact that the starting points are quite dissimilar. Perhaps you can help me better understand? Try hard to be objective and then study the graph. 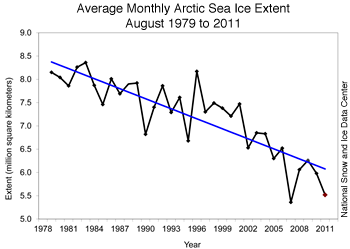 Is the volume lost during this melt season comparable to that of 2007? Hatter777, The volume lost is a key question. Right now, it is not clear. Nevertheless, it appears that present Arctic Sea Ice volume is lower than 2007. |
|
|
|
Post by thermostat on Sept 12, 2011 2:42:23 GMT
icefisher,
Time to get real, agreed. What we know is real is that the idea of the Anthropocene is a geologic concept.
I mean really Tstat. No reason geologists shouldn't get their fair share of global war. . . .er . . . .climate change research dollars!!! icefisher, I can begin to understand how your imagination works. What I question is whether you understand the first thing about how scientific research works. |
|
|
|
Post by thermostat on Sept 12, 2011 2:24:40 GMT
You were talking about relevant science but said nothing substantive. When confronted with substantive science you did this: You have no interest in a relevant discussion. Your only interest is in so-called consensus positions and declarations by fiat. icefisher, do you have any comments on the previous posts you made earlier today? (you appeared before to make a big deal about that unattributed graph you posted multiple times.) |
|
|
|
Post by thermostat on Sept 12, 2011 2:20:40 GMT
Thermostat:I know Geologists, some geologists, are driving the Anthropocence concept. My point is, even tho they profess to be geologists, they are trying to make something out of nothing as of yet.
I read their reasoning, and my first thought was, you have to be kidding. You call yourselves geologists? Then I read more about the trail to their thoughts. It was all about climate, and not really about the rest of the items required to truely even begin to be an epoc.
The real truth is geology has been getting screwed. All the sciences that have linked potential disasters to AGW have been soaking up all the grant dollars. There is a need to make a case for rocks!!!!!  icefisher, Time to get real, agreed. What we know is real is that the idea of the Anthropocene is a geologic concept. |
|


