|
|
Post by meemoeuk on Oct 15, 2010 11:18:50 GMT
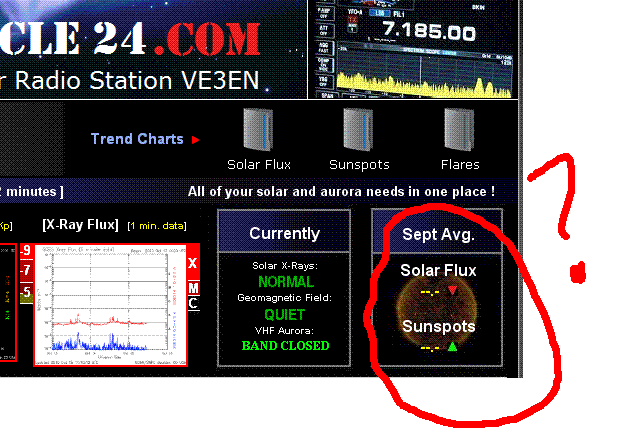
 Anyone know why the averages aren't up yet? I thought it was all automated and that there's several other monitoring institutions and hundred of enthusiastic sun watchers ready with auxilary data within minutes of the usual data source failing? You need layman like me to dig you out? ;D |
|
|
|
Post by af4ex on Oct 15, 2010 14:53:03 GMT
> Anyone know why the averages aren't up yet? > I thought it was all automated and that there's .... I don't maintain this website, so I don't know exactly where the SFI for that display is 'scraped' from. But it is apparently down or showing a 'missing' value (e.g. -9999). Lower your gaze to the N0NBH 'Solar Terrestrial Data' gadget and you'll see that SFI is currently 80. So, N0NBH gets his data from a different source, maybe this one: www.swpc.noaa.gov/ftpdir/latest/wwv.txtIn general, these automated displays tend to be more reliable than manually-posted entries, because computers don't get bored, distracted or de-motivated, so they're more likely to perform consistently, 24/7, than a human. But computers do get 'sick', like humans, and the network connections are not always there either, for one reason or another. So expecting this data to be displayed faithfully, 100% of the time, is not a realistic expectation. (maybe 95% or greater would be more realistic) Hope that helps, John/af4ex |
|
|
|
Post by af4ex on Oct 16, 2010 0:01:31 GMT
It occurred to me that SC24.com might be depending on an RSS feed to get the monthly indices. But looking at the NOAA site (http://www.swpc.noaa.gov/) I couldn't find any RSS links. FYI, the monthly summaries for Sept 2010 observed SN and SFI are posted here: www.swpc.noaa.gov/ftpdir/weekly/RecentIndices.txtThis table has a fixed structure, so should be easy to scrape the numbers out with Perl or other web tools. Yes, a lot of work just to avoid depending on RSS links. I've written hacks like this myself to get web data. Some of these hacks have worked flawlessly for years, others have bombed when the website changed the URL or format. More evidence that there's really no foolproof way to keep posted data like this up to date. Maybe Kevin or Bob can explain further what's going on with the monthly numbers. |
|
|
|
Post by dadyboo on Jan 8, 2011 3:25:03 GMT
It may be my dyslexia or dirty glasses, but it appears that the sunspot Dec. average of 22 is actually graphed at about the 15 mark on the ISES Sunspot progression graph. I think that the last few months have been graphed lower than the posted averages as well??
|
|
|
|
Post by af4ex on Jan 8, 2011 4:49:24 GMT
ISES is an international organization, headquartered in Germany www.ises.org/ises.nsfThey use the 'official' SIDC ("RI") values instead of the the Boulder values ("SWO"). (See: www.swpc.noaa.gov/ftpdir/weekly/README3)You can see both values listed here: www.swpc.noaa.gov/ftpdir/weekly/RecentIndices.txt# Source RI: S.I.D.C. Brussels International Sunspot Number.
# Source SWO: SWPC Space Weather Operations (SWO).
# YR MO SWO RI RI/SW SWO RI 10.7cm 10.7cm Ap Ap
#-------------------------------------------------------------------------------
2010 12 22.0 14.5 0.66 -1.0 -1.0 84.3 -1.0 3 -1.0
So the official SIDC value you're seeing is indeed 14.5, not 22. |
|