|
|
Post by icefisher on Sept 29, 2018 2:22:49 GMT
This thread, which I started, does not help much, nor was it intended to, answer the question you pose. It was intended to describe, not quantify, the greenhouse gas effect in order to better understand why most of the oft-quoted sceptics like Curry, Spencer, Watts, Pielke, Heller,and Lindzen concur that there is such an effect. Nobody who is anybody has said there is no greenhouse effect. This planet would not be habitable by humans if there were no greenhouse effect. When it comes to the what is known as the no-feedback sensitivity (how much warming CO2 provides without feedback) one should read this article to get an idea of the state of the science. judithcurry.com/2010/12/11/co2-no-feedback-sensitivity/ |
|
|
|
Post by nautonnier on Sept 29, 2018 11:43:25 GMT
This thread, which I started, does not help much, nor was it intended to, answer the question you pose. It was intended to describe, not quantify, the greenhouse gas effect in order to better understand why most of the oft-quoted sceptics like Curry, Spencer, Watts, Pielke, Heller,and Lindzen concur that there is such an effect. Nobody who is anybody has said there is no greenhouse effect. This planet would not be habitable by humans if there were no greenhouse effect. When it comes to the what is known as the no-feedback sensitivity (how much warming CO2 provides without feedback) one should read this article to get an idea of the state of the science. judithcurry.com/2010/12/11/co2-no-feedback-sensitivity/ But they fail to look at the entire cycle. A warm atmosphere blowing over a water surface results in a cooling of the water surface. It is why we blow on coffee, why hair and hand dryers blow hot air, warm air increases the evaporative heat loss and our wet hands feel cold in the hot airstream. The humid air convects upward as it is less dense than the dry air. As it cools with the pressure drop (wet adiabatic lapse rate) it will eventually condense and {cough} release the latent heat{cough} and the droplets of condensed water form clouds raising the albedo further cooling the surface. If the droplets coalesce sufficiently they will precipitate to the surface cooling it even further. This is the hyrdologic cycle and it is homeostatic. You cannot take one part of a homeostatic process in isolation. It is also not purely radiative (hot body vs cold body) the surface of the oceans 75% of the Earth and the atmosphere are both actively chaotically mixed fluids and the top 6 meters or so of the oceans hold more heat than the entire atmosphere. So a couple of tenths of a degree change in atmospheric temperature will have no measurable effect on the SST except that the warmer air may increase the hydrologic cycle and cooling as detailed above. No argument that CO2 molecules absorb infrared photons, but in a dynamic homeostatic system the result of that absorption if it heats the atmosphere will be cooling of the surface. Meanwhile, the CO2 molecules are collided with start vibrating with the transfer of kinetic energy and radiate that energy as a photon - cooling the atmosphere. CO2 is an equal opportunity radiative gas. Pointing at one part of coupled dynamic chaotic systems and saying that's hot so the entire system will get hot is simplistic. It may have entirely the opposite overall effect viewed from outside the hohlraum |
|
|
|
Post by icefisher on Sept 30, 2018 18:06:18 GMT
Nobody who is anybody has said there is no greenhouse effect. This planet would not be habitable by humans if there were no greenhouse effect. When it comes to the what is known as the no-feedback sensitivity (how much warming CO2 provides without feedback) one should read this article to get an idea of the state of the science. judithcurry.com/2010/12/11/co2-no-feedback-sensitivity/ But they fail to look at the entire cycle. A warm atmosphere blowing over a water surface results in a cooling of the water surface. It is why we blow on coffee, why hair and hand dryers blow hot air, warm air increases the evaporative heat loss and our wet hands feel cold in the hot airstream. The humid air convects upward as it is less dense than the dry air. As it cools with the pressure drop (wet adiabatic lapse rate) it will eventually condense and {cough} release the latent heat{cough} and the droplets of condensed water form clouds raising the albedo further cooling the surface. If the droplets coalesce sufficiently they will precipitate to the surface cooling it even further. This is the hyrdologic cycle and it is homeostatic. You cannot take one part of a homeostatic process in isolation. It is also not purely radiative (hot body vs cold body) the surface of the oceans 75% of the Earth and the atmosphere are both actively chaotically mixed fluids and the top 6 meters or so of the oceans hold more heat than the entire atmosphere. So a couple of tenths of a degree change in atmospheric temperature will have no measurable effect on the SST except that the warmer air may increase the hydrologic cycle and cooling as detailed above. No argument that CO2 molecules absorb infrared photons, but in a dynamic homeostatic system the result of that absorption if it heats the atmosphere will be cooling of the surface. Meanwhile, the CO2 molecules are collided with start vibrating with the transfer of kinetic energy and radiate that energy as a photon - cooling the atmosphere. CO2 is an equal opportunity radiative gas. Pointing at one part of coupled dynamic chaotic systems and saying that's hot so the entire system will get hot is simplistic. It may have entirely the opposite overall effect viewed from outside the hohlraum Absolutely! Gerlich and Tscheuschner itemized the issues one by one. Climate science did not respond with anything but the fact that greenhouse gases slow cooling via emission of radiant energy. That in itself is an almost meaningless response because greenhouse gases are not a condition sufficient to slow cooling via radiant energy as those greenhouse gases must first be warmed to slow cooling. The entire issue requires an extremely close evaluation, an evaluation that has never occurred and an evaluation that science itself resists out of fear that it will delay a response (funding for science on everything linked to global warming?). For the past 15 years I have worked in an area where if you want a grant to study something in nature you had to say it was going to evaluate the effects of global warming. It matters not if its polar bears, fish, birds. . . .you name it. The very idea of science claiming the science is settled itself is totally religious. Science is never settled. Science is a process of ever closer examination. Here science is actually resisting that, if not directly, indirectly. Even this discussion here is considered heresy. |
|
|
|
Post by duwayne on Oct 1, 2018 21:59:02 GMT
Nautonnier, this excerpt is from the Madden Julian Oscillation article in Wikipedia. From your extensive knowledge of weather, can you explain the last sentence (underlined) to me? "Behavior (of the Madden Julian Oscillation) Distinct patterns of lower-level and upper-level atmospheric circulation anomalies accompany the MJO-related pattern of enhanced or decreased tropical rainfall across the tropics. These circulation features extend around the globe and are not confined to only the eastern hemisphere. The Madden–Julian oscillation moves eastward at between 4 m/s (14 km/h, 9 mph) and 8 m/s (29 km/h, 18 mph) across the tropics, crossing the Earth's tropics in 30 to 60 days—with the active phase of the MJO tracked by the degree of outgoing long wave radiation, which is measured by infrared-sensing geostationary weather satellites. The lower the amount of outgoing long wave radiation, the stronger the thunderstorm complexes, or convection, is within that region." en.wikipedia.org/wiki/Madden%E2%80%93Julian_oscillation |
|
|
|
Post by nautonnier on Oct 2, 2018 9:42:08 GMT
Nautonnier, this excerpt is from the Madden Julian Oscillation article in Wikipedia. From your extensive knowledge of weather, can you explain the last sentence (underlined) to me? "Behavior (of the Madden Julian Oscillation) Distinct patterns of lower-level and upper-level atmospheric circulation anomalies accompany the MJO-related pattern of enhanced or decreased tropical rainfall across the tropics. These circulation features extend around the globe and are not confined to only the eastern hemisphere. The Madden–Julian oscillation moves eastward at between 4 m/s (14 km/h, 9 mph) and 8 m/s (29 km/h, 18 mph) across the tropics, crossing the Earth's tropics in 30 to 60 days—with the active phase of the MJO tracked by the degree of outgoing long wave radiation, which is measured by infrared-sensing geostationary weather satellites. The lower the amount of outgoing long wave radiation, the stronger the thunderstorm complexes, or convection, is within that region." en.wikipedia.org/wiki/Madden%E2%80%93Julian_oscillationIt obviously depends on how large the 'region' is and how the infrared is sensed. I know you are trying to say that the IR from storms sensed by the satellites does not exist. Perhaps you would explain how such storms show up on the IR satellites as they obviously don't output infrared.   Infrared view of storms tuned to see the storm 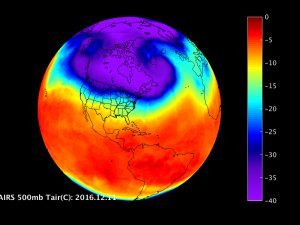 Infrared view of the surface not tuned to see the storms Infrared is released wherever anything that can release infrared does so such as water vapor or CO2. Infrared is released by storms at height as well. I presume that as one of the effects of storms is to cool the surface that the outgoing infrared from the surface reduces as it has been cooled - like the snail trails left by hurricanes in the SST. So the more stormy the weather the cooler the surface becomes. But you cannot say that storms do not release infrared - as that is obviously the case as it is sensed by the satellites and is the way they are tracked. |
|
|
|
Post by icefisher on Oct 2, 2018 18:06:24 GMT
Nautonnier, this excerpt is from the Madden Julian Oscillation article in Wikipedia. From your extensive knowledge of weather, can you explain the last sentence (underlined) to me? "Behavior (of the Madden Julian Oscillation) Distinct patterns of lower-level and upper-level atmospheric circulation anomalies accompany the MJO-related pattern of enhanced or decreased tropical rainfall across the tropics. These circulation features extend around the globe and are not confined to only the eastern hemisphere. The Madden–Julian oscillation moves eastward at between 4 m/s (14 km/h, 9 mph) and 8 m/s (29 km/h, 18 mph) across the tropics, crossing the Earth's tropics in 30 to 60 days—with the active phase of the MJO tracked by the degree of outgoing long wave radiation, which is measured by infrared-sensing geostationary weather satellites. The lower the amount of outgoing long wave radiation, the stronger the thunderstorm complexes, or convection, is within that region." en.wikipedia.org/wiki/Madden%E2%80%93Julian_oscillationAn important element in the view being discussed is the light sampling frequencies of the sensors. The frequencies are chosen to specifically focus on frequencies that specifically water vapor has the strongest output. Condensed water also radiates at the same frequency as the peak water vapor frequencies but water radiates over a much larger spectrum than does water vapor. Therefore water gives off a lot more energy than does water vapor at the same temperature. If the satellites used broadband infrared sensors the effect would still be there but it might not be discernable with the naked eye because of being masked by strong water radiation that penetrates the water vapor. The narrow choice of frequencies is made precisely to make the effect visible. And the water vapor would not be strongly convecting unless it was hotter than the surrounding air so while its cold and blocking radiation at these select frequencies from lower in the atmosphere it all represents a far greater amount of heat in the atmosphere throughout the entire air column than before the convection. |
|
|
|
Post by duwayne on Oct 2, 2018 20:12:54 GMT
Nautonnier, this excerpt is from the Madden Julian Oscillation article in Wikipedia. From your extensive knowledge of weather, can you explain the last sentence (underlined) to me? "Behavior (of the Madden Julian Oscillation) Distinct patterns of lower-level and upper-level atmospheric circulation anomalies accompany the MJO-related pattern of enhanced or decreased tropical rainfall across the tropics. These circulation features extend around the globe and are not confined to only the eastern hemisphere. The Madden–Julian oscillation moves eastward at between 4 m/s (14 km/h, 9 mph) and 8 m/s (29 km/h, 18 mph) across the tropics, crossing the Earth's tropics in 30 to 60 days—with the active phase of the MJO tracked by the degree of outgoing long wave radiation, which is measured by infrared-sensing geostationary weather satellites. The lower the amount of outgoing long wave radiation, the stronger the thunderstorm complexes, or convection, is within that region." en.wikipedia.org/wiki/Madden%E2%80%93Julian_oscillationIt obviously depends on how large the 'region' is and how the infrared is sensed. I know you are trying to say that the IR from storms sensed by the satellites does not exist. Perhaps you would explain how such storms show up on the IR satellites as they obviously don't output infrared. Infrared view of storms tuned to see the storm Infrared view of the surface not tuned to see the storms Infrared is released wherever anything that can release infrared does so such as water vapor or CO2. Infrared is released by storms at height as well. I presume that as one of the effects of storms is to cool the surface that the outgoing infrared from the surface reduces as it has been cooled - like the snail trails left by hurricanes in the SST. So the more stormy the weather the cooler the surface becomes. But you cannot say that storms do not release infrared - as that is obviously the case as it is sensed by the satellites and is the way they are tracked. Nautonnier, I’m glad to see that you noticed that IR emissions are not elevated in thunderstorms. This of course means that when water condenses and the latent heat is released as sensible heat, the sensible heat does not immediately become IR and radiate away. I am not saying that there are no IR emissions from a thunderstorm even though they are reduced. I think you owe me an apology on that one. I’m going to repeat one more time the explanation for the charts you show above. Please read carefully. Photons are particles of energy. Every photon has a wavelength. The wavelength is generally indicative of the temperature of the surface which emitted the photon. Hand held units can measure the temperature of a refrigerator by measuring the wavelength of the photons emitted by the refrigerator. Satellites can measure the temperature of the surfaces below (land or sea or clouds) by reading the wavelength of the photons (IR) emitted. A colored graph can be made based on these temperature indications or “brightness” as it is sometimes called. If the surface being measured is the top of a high cloud which obviously is very cold it may be shown as dark red while the ocean surface which is much warmer can be shown as blue. This is what is shown on the first graph above. Someone who provides this description is not claiming there is no IR emitted from thunderstorms or high clouds. Such a graph is not a representation of the quantity of IR. It is also possible to measure the quantity of the photons emitted from the surfaces and make a graph from these measurements which indicates the quantity of IR emissions. As shown in the referenced article, such a graph shows there are lower IR emissions from thunderstorms than non-thunderstorm areas. |
|
|
|
Post by icefisher on Oct 2, 2018 23:24:25 GMT
Nautonnier, I’m glad to see that you noticed that IR emissions are not elevated in thunderstorms. In fact just the opposite is true. You can rightly claim that emissions to space are attenuated in the specific frequencies that the satellite picture is sampling while the light vapors are rising. But that doesn't measure emissions outside of the narrow water vapor band and it does not measure emissions in the same frequency as the sampling instrument from water under a layer of water vapor. Water vapor is lighter than air and water is heavier than air. Water vapor rises and water falls in the air, in general. Thus without an elevation reference its not possible from the water vapor satellite sensor information to observe how much heat is being infused into the higher atmosphere. In general we know it to be a lot as the wet lapse rate cools far slower than the dry lapse rate. The cold stuff at the top of the thunderstorms is rapidly rising water vapor. After it peaks the bright colors representing the cold water vapor quickly darken. This likely represents a phase in a thunderstorm where most of the rising water vapor is actually converting to water. If it went up there and stayed cold. . . .well that would be another matter. In my crude experiment with latent heat there was no rising water vapor or rising water. There was a flash freeze without objects moving and when all done a solid cube of ice with some residual water outside of the cube in the bottle while everything in the bottle increased in temperature (by about 14F). Now the latent heat associated with freezing is estimated as capable of warming the water by a lot more than that. So where did the rest of the heat go? I would love to see some carefully conducted experiments varied in various ways to induce supercooling to better measure the release of latent heat in practical situations such as those that might be encountered in our climate. I recall when Radiant was here I pointed out that the arctic climate people were saying the colder than average summer temperatures in the arctic was caused by the absorption of heat by melting ice. So I dared suggest that some of those winter heat spikes we see were caused by the opposite, ice freezing. Radiant didn't like that spawning one of the most disagreeable threads on this board over what latent heat is, how its released, etc. Seems to me what is needed is more laboratory work on this topic. |
|
|
|
Post by duwayne on Oct 3, 2018 12:56:52 GMT
Nautonnier, I’m glad to see that you noticed that IR emissions are not elevated in thunderstorms. In fact just the opposite is true. You can rightly claim that emissions to space are attenuated in the specific frequencies that the satellite picture is sampling while the light vapors are rising. But that doesn't measure emissions outside of the narrow water vapor band and it does not measure emissions in the same frequency as the sampling instrument from water under a layer of water vapor. Water vapor is lighter than air and water is heavier than air. Water vapor rises and water falls in the air, in general. Thus without an elevation reference its not possible from the water vapor satellite sensor information to observe how much heat is being infused into the higher atmosphere. In general we know it to be a lot as the wet lapse rate cools far slower than the dry lapse rate. The cold stuff at the top of the thunderstorms is rapidly rising water vapor. After it peaks the bright colors representing the cold water vapor quickly darken. This likely represents a phase in a thunderstorm where most of the rising water vapor is actually converting to water. If it went up there and stayed cold. . . .well that would be another matter. In my crude experiment with latent heat there was no rising water vapor or rising water. There was a flash freeze without objects moving and when all done a solid cube of ice with some residual water outside of the cube in the bottle while everything in the bottle increased in temperature (by about 14F). Now the latent heat associated with freezing is estimated as capable of warming the water by a lot more than that. So where did the rest of the heat go? I would love to see some carefully conducted experiments varied in various ways to induce supercooling to better measure the release of latent heat in practical situations such as those that might be encountered in our climate. I recall when Radiant was here I pointed out that the arctic climate people were saying the colder than average summer temperatures in the arctic was caused by the absorption of heat by melting ice. So I dared suggest that some of those winter heat spikes we see were caused by the opposite, ice freezing. Radiant didn't like that spawning one of the most disagreeable threads on this board over what latent heat is, how its released, etc. Seems to me what is needed is more laboratory work on this topic. Icefisher, first off, when rereading my statement that you quoted to start your post, I see that the second sentence is more confusing than helpful, so I went back to my original post and eliminated the second sentence. I think you understood what I was saying but I wanted to clarify it. Secondly, I have several questions concerning your post two of which are listed below. Yes or no answers are preferred along with anything else you might want to add. Here is the quote from the original Wikipedia Madden-Julian article. “The lower the amount of outgoing long wave radiation, the stronger the thunderstorm complexes, or convection, is within that region.” Is it a fact that this is an incorrect statement because they are measuring only a portion of the outgoing long wave radiation? Is it a fact that gases in the atmosphere stratify according to their molecular weights? Also, when you reference a chart, it would be helpful if you specify which chart or charts. There are two types of charts which have been mentioned. One type indicates temperature and the other indicates the quantity of IR. |
|
|
|
Post by missouriboy on Oct 3, 2018 18:24:04 GMT
I would've thought that some bright ladd or lass from NASA (or elsewhere) would have already sampled representative atmospheric sections under low to high humidity and various cloud cover with various sensor ranges. Don't any weather (or climate) models require at least a limited set of such data?
|
|
|
|
Post by sigurdur on Oct 3, 2018 23:07:16 GMT
I would've thought that some bright ladd or lass from NASA (or elsewhere) would have already sampled representative atmospheric sections under low to high humidity and various cloud cover with various sensor ranges. Don't any weather (or climate) models require at least a limited set of such data? Are you kidding Missouri? Climate models needing data? Gosh, I am still laughing at that one. |
|
|
|
Post by sigurdur on Oct 3, 2018 23:08:36 GMT
I am biting my tongue, in regards to Latent Heat. And the confusion that the only LWR band is CO2.
|
|
|
|
Post by missouriboy on Oct 4, 2018 2:04:14 GMT
I would've thought that some bright ladd or lass from NASA (or elsewhere) would have already sampled representative atmospheric sections under low to high humidity and various cloud cover with various sensor ranges. Don't any weather (or climate) models require at least a limited set of such data? Are you kidding Missouri? Climate models needing data? Gosh, I am still laughing at that one. Sorry ... don't know what I was thinking.  |
|
|
|
Post by icefisher on Oct 4, 2018 4:01:52 GMT
Icefisher, first off, when rereading my statement that you quoted to start your post, I see that the second sentence is more confusing than helpful, so I went back to my original post and eliminated the second sentence. I think you understood what I was saying but I wanted to clarify it. Secondly, I have several questions concerning your post two of which are listed below. Yes or no answers are preferred along with anything else you might want to add. Here is the quote from the original Wikipedia Madden-Julian article. “The lower the amount of outgoing long wave radiation, the stronger the thunderstorm complexes, or convection, is within that region.” Is it a fact that this is an incorrect statement because they are measuring only a portion of the outgoing long wave radiation? No its not necessarily an incorrect statement. You asked for clarification. The clarification is that in the exact spot of enhanced convection looking at the top of the thunderhead there is: 1) primarily water vapor not yet condensed; 2) less emissions to space out of the atmosphere in bands tuned to water vapor's strongest emissions; 3) one heckuva a lot more heat than normal in the convecting air column and 4) the water vapor sampled by the satellite is colder than normal (because of gas laws as that vapor started out probably from very warm seawater). One cannot deduce that latent heat is not being released by condensing water via emissions because the IR from such releases is largely being absorbed by water in the convecting column and colder water vapor above. I used the word necessarily because in my research over the years I have found a lot of assumptions regarding phenomena based on partial information that leads to wrong conclusions. If it hasn't been studied carefully often key information is omitted when arriving at a conclusion. The point here is that very definitely water vapor is colder and higher, but it may not have been even studied what warmer condensed non-convecting water is emitting in a thunderhead. The purpose of the water vapor sensor is to find thunderstorms and it does a good job at that. The quality of the job done regarding other objectives requires some skepticism. That should not be surprising because climate science is so young yet the science has been settled so why study anything? Obviously looking at water vapor sensors it is correct to say that in those frequencies there is less radiation. I have seen these loops. The question I would ask is why does warming occur rather quickly in the same spot right after the coldest readings are obtained at the center of the convecting column? Shouldn't that water zoom up there and linger or cool via radiation to space? Is it a fact that gases in the atmosphere stratify according to their molecular weights? Its a fact they could if there were not sufficient disturbance to cause them to mix. Not sure why you are asking the question it seems apparent there is some stratification that occurs. Also, when you reference a chart, it would be helpful if you specify which chart or charts. There are two types of charts which have been mentioned. One type indicates temperature and the other indicates the quantity of IR. NOOA provides 3 satellite charts on local forecast pages (at least at the 3 locations I monitor regularly) visible, water vapor, and infrared. The water vapor and infrared charts use sensors tuned to different frequencies. Both use narrow band. One tuned to water for clouds and the other to water vapor. Those are two I referred to. |
|
|
|
Post by nautonnier on Oct 4, 2018 9:57:30 GMT
I won't try to put quotes from the voluminous posts above into this - but just go over some points. Infrared from the surface gets absorbed by 'green house gases' previously known as radiative gases. Therefore, where there are a lot of clouds made up of water droplets less radiation from the surface will reach a satellite as it was absorbed on its way out. Unlike CO2 water droplets can absorb a lot of infrared and will not release it until a phase change to a lower (frozen) state. Therefore, clouds will mask radiation from the surface. "Water vapor and clouds are among the most
important components of the atmosphere that
modulate the Earth radiation budget by means
of the strong contributions to the greenhouse effect
and the planetary albedo. They trap a significant
amount of the longwave thermal infrared radiation
emitted by the underlying atmosphere and the surface
(greenhouse effect) and ref lect back to space the
shortwave solar incoming radiation (albedo effect)." journals.ametsoc.org/doi/pdf/10.1175/BAMS-D-13-00286.1Therefore the more cloudy the less infrared from the surface will be seen. This paper is a little disappointing as it only uses ground based sensors that show a huge amount of downwelling infrared from Cirrus and little from low cloud but is not useful for storms. Due to the absorption of Downwelling Longwave Radiation by the clouds themselves. Similar to looking at the clouds from above where any infrared release will be attenuated or blocked by absorption within the cloud - the MJO effect? Water vapor changing state releases latent heat - a LOT of latent heat see the table of latent heats here: en.wikipedia.org/wiki/Latent_heat2264.705 Kilojoules per kilogram. Latent heat output can vary with temperature but within the atmospheric temperature ranges this can be disregarded: .png) A LOT of energy is released
"On the other hand, the molecules in liquid water are held together by relatively strong hydrogen bonds, and its enthalpy of vaporization, 40.65 kJ/mol, is more than five times the energy required to heat the same quantity of water from 0 °C to 100 °C (cp = 75.3 J K−1 mol−1)." when water condenses and absorbed when it vaporizes. So where does 2264.705 Kilojoules per kilogram of heat go when water vapor condenses? The specific heat of a mixture of Oxygen and Nitrogen is effectively 1 at the temperatures in the atmosphere (O2 0.910 kJ/kg K, N2 1.039 kJ/kg K )) ( www.engineeringtoolbox.com/oxygen-d_978.html). "Gas radiation In gas radiation, one has to distinguish between the gases which are transparent to radiation and which emit and absorb radiations. All diatomic gases like nitrogen and oxygen are transparent to radiation that means they neither emit nor absorb radiation at low temperatures. Whereas, tn-atomic gases like CO2, H20, SO2 absorb and emit radiation to a considerable degree so that they are important in heat exchange" nptel.ac.in/courses/113104058/mme_pdf/Lecture31.pdfFor interest look here: www1.lsbu.ac.uk/water/water_vibrational_spectrum.html The animated figure of absorption spectra gives some idea of the type of vibrations that the water molecule may have. Now the vibration is mainly of the hydrogen atoms which are the lightest atom in the periodic table - it is unclear how vibration of an atom in a dipole molecule with an atomic weight of one can impart significant kinetic energy by collision with a Nitrogen molecule N2 with an atomic weight of approx 28 or an Oxygen molecule O2 with an atomic weight of approx 32. So in summary, a huge amount of heat 'is released' by water molecules changing state. There is no clear way that the heat 'released' can increase the kinetic energy of N2 or O2 molecules by 'conduction/collision' - (aka sensible heat - non-radiative energy transfer), in any case the specific heats of those gases being so very low compared to the heat released would mean a huge increase in their temperature that has not been observed. Release of infrared is observed and the N2/O2 are transparent to infrared while water vapor by definition is not so presumably water vapor, droplets and ice absorb some of the infrared attenuating the signal but at the cloud tops there is less water and only transparent N2/O2 so infrared from latent heat 'release' in the cloud tops will be visible. |
|


