|
|
Post by nautonnier on Jun 13, 2021 12:30:04 GMT
They have let a media studies student do the diagrams so they are '3D and live graphics' very fancy looking but try to put the diagrams into lecture notes.  |
|
|
|
Post by sigurdur on Jun 13, 2021 13:31:19 GMT
|
|
|
|
Post by sigurdur on Jun 13, 2021 21:00:41 GMT
k It is very hard to find graphs of water vapor in the troposphere. Here is the link to data............care to investigate? airs.jpl.nasa.gov/ |
|
|
|
Post by missouriboy on Jun 13, 2021 21:05:47 GMT
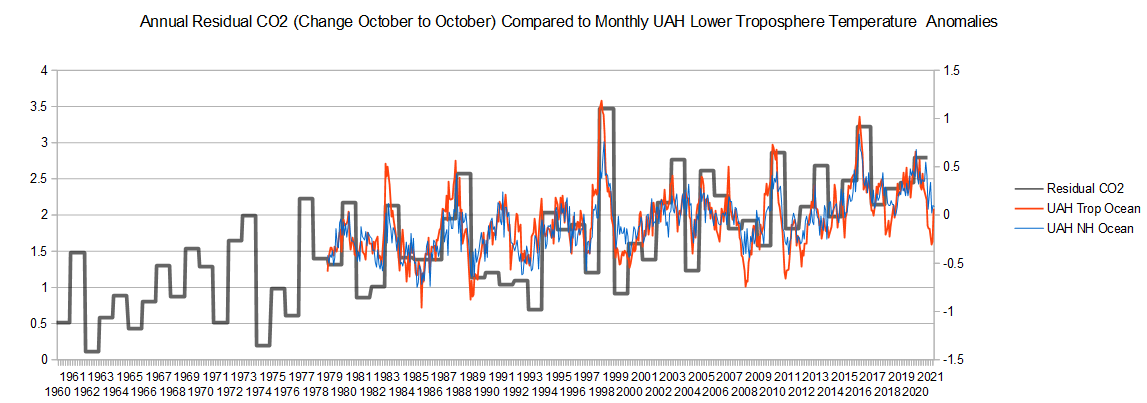
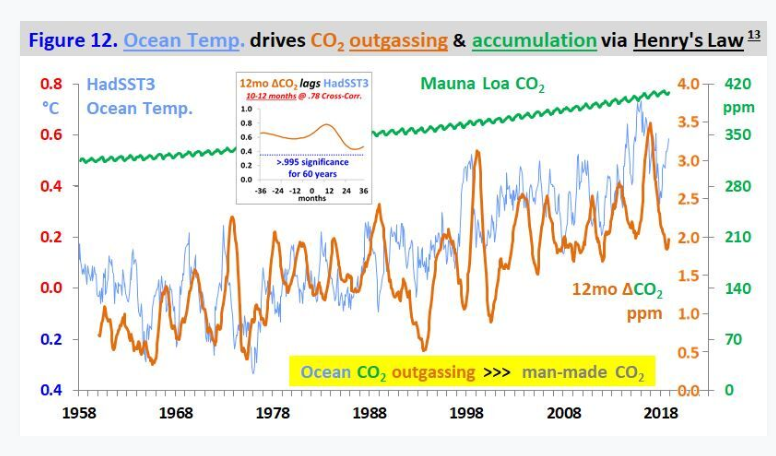
I quickly reproduced the "annual uncompensated (residual) CO2" values (October to October CO2 change) that Spencer used and compared them to the UAH Lower Troposphere temperature anomalies for the tropical and northern hemisphere. As he showed, there is a very close relationship to EL Nino events throughout the series. The front edge of each CO2 block is November, so I need to check where in the 12-month block (if any) where CO2 spikes. There is also something wierd in the 1988-94 time period. This also not the first time this has been done. The second chart is better than mine. I found it in my saved images, but must track down the source.   |
|
|
|
Post by sigurdur on Jun 15, 2021 13:40:24 GMT
|
|
|
|
Post by nautonnier on Jun 15, 2021 19:45:41 GMT
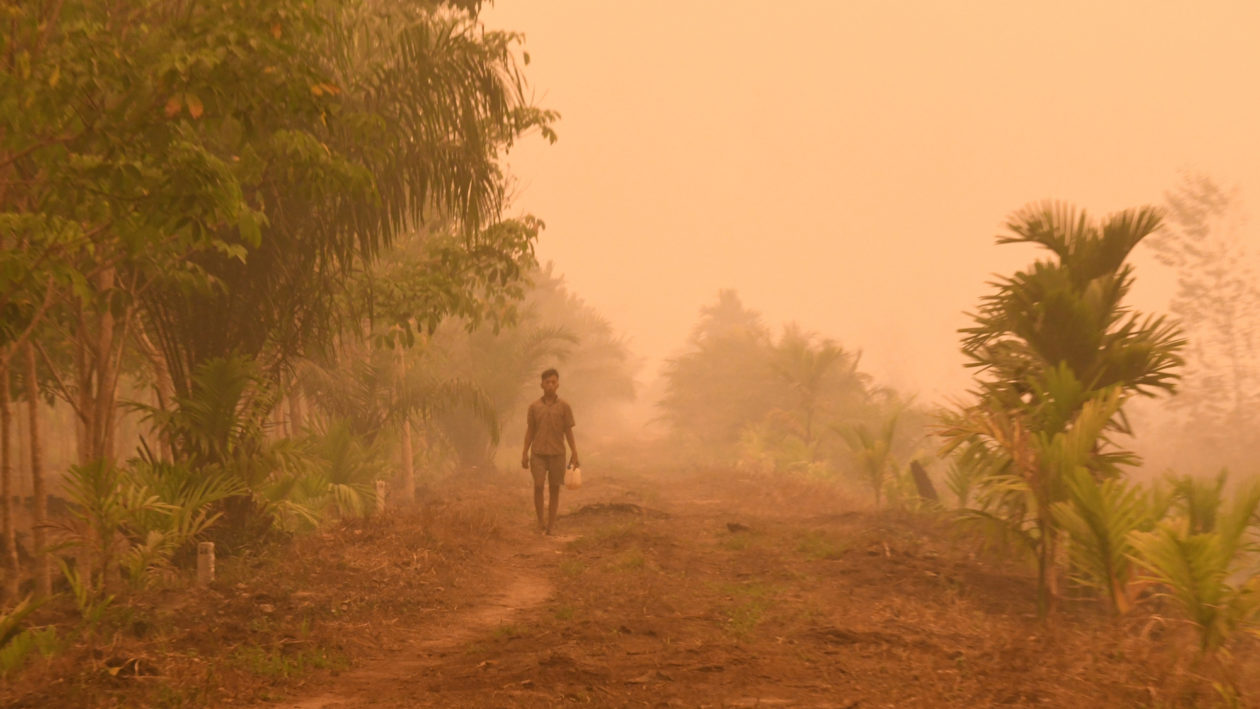
 "The Time Has Come to Rein In the Global Scourge of Palm Oil "The Time Has Come to Rein In the Global Scourge of Palm Oil
The cultivation of palm oil, found in roughly half of U.S. grocery products, has devastated tropical ecosystems, released vast amounts of C02 into the atmosphere, and impoverished rural communities. But efforts are underway that could curb the abuses of this powerful industry.
These days, palm oil accounts for one-third of total global vegetable oil consumption."The time has come to rein in the global scourge of palm-oil |
|
|
|
Post by nautonnier on Jun 15, 2021 20:11:29 GMT
"Insensitivity of global warming potentials to carbon dioxide emission scenarios
Ken Caldeira & James F. Kasting
Nature volume 366, pages 251–253 (1993)Cite this article
Abstract
GLOBAL warming potentials for radiatively active trace gases (such as methane and chlorofluorocarbons) have generally been expressed1–2 relative to the time-integrated climate forcing per unit emission of carbon dioxide. Previous attempts to estimate the integrated climate forcing per unit CO2 emitted have focused on perturbations to steady-state conditions in carbon-cycle models. But for non-steady-state conditions, the integrated climate forcing from a CO2 perturbation depends both on the initial conditions and on future atmospheric CO2 concentrations. As atmospheric CO2concentrations increase, the radiative forcing per unit CO2 emitted will become smaller because the strongest absorption bands will already be saturated. At the same time, higher concentrations of dissolved carbon in the surface ocean will reduce the ocean's ability to absorb excess CO2from the atmosphere. Each of these effects taken alone would affect the climate forcing from a pulse of emitted CO2 by a factor of three or more; but here we show that, taken together, they compensate for each other. The net result is that the global warming potential of CO2 relative to other radiatively active trace gases is nearly independent of the CO2emission scenario. Thus, the concept of the global warming potential remains useful, despite the nonlinearities in the climate system and uncertainties in future emissions."Abstract
|
|
|
|
Post by missouriboy on Jun 16, 2021 4:01:20 GMT
Here is an old article from the Chiefio on CO2 sources, sinks and mechanics of entering and leaving the atmosphere. Some good maps too. For reference please note that 2000 (the map) was a La Nina year (see chart a couple of posts up) and CO2 flux was amazingly high and extensive into the Central Pacific Ocean. Do CO2-rich upwelling waters need a small boost in tropical heating to more efficiently translocate to the atmosphere? Or do they just bubble out like a can of soda? chiefio.wordpress.com/2013/01/21/co2-warm-dry-vs-cold-wet-hypothesis/ |
|
|
|
Post by missouriboy on Jun 16, 2021 14:18:06 GMT
|
|
|
|
Post by Ratty on Jun 16, 2021 17:27:46 GMT
"Insensitivity of global warming potentials to carbon dioxide emission scenarios
Ken Caldeira & James F. Kasting
Nature volume 366, pages 251–253 (1993)Cite this article
Abstract
GLOBAL warming potentials for radiatively active trace gases (such as methane and chlorofluorocarbons) have generally been expressed1–2 relative to the time-integrated climate forcing per unit emission of carbon dioxide. Previous attempts to estimate the integrated climate forcing per unit CO2 emitted have focused on perturbations to steady-state conditions in carbon-cycle models. But for non-steady-state conditions, the integrated climate forcing from a CO2 perturbation depends both on the initial conditions and on future atmospheric CO2 concentrations. As atmospheric CO2concentrations increase, the radiative forcing per unit CO2 emitted will become smaller because the strongest absorption bands will already be saturated. At the same time, higher concentrations of dissolved carbon in the surface ocean will reduce the ocean's ability to absorb excess CO2from the atmosphere. Each of these effects taken alone would affect the climate forcing from a pulse of emitted CO2 by a factor of three or more; but here we show that, taken together, they compensate for each other. The net result is that the global warming potential of CO2 relative to other radiatively active trace gases is nearly independent of the CO2emission scenario. Thus, the concept of the global warming potential remains useful, despite the nonlinearities in the climate system and uncertainties in future emissions."Abstract Is there a plain English version?  |
|
|
|
Post by nautonnier on Jun 16, 2021 18:55:24 GMT
"Insensitivity of global warming potentials to carbon dioxide emission scenarios
Ken Caldeira & James F. Kasting
Nature volume 366, pages 251–253 (1993)Cite this article
Abstract
GLOBAL warming potentials for radiatively active trace gases (such as methane and chlorofluorocarbons) have generally been expressed1–2 relative to the time-integrated climate forcing per unit emission of carbon dioxide. Previous attempts to estimate the integrated climate forcing per unit CO2 emitted have focused on perturbations to steady-state conditions in carbon-cycle models. But for non-steady-state conditions, the integrated climate forcing from a CO2 perturbation depends both on the initial conditions and on future atmospheric CO2 concentrations. As atmospheric CO2concentrations increase, the radiative forcing per unit CO2 emitted will become smaller because the strongest absorption bands will already be saturated. At the same time, higher concentrations of dissolved carbon in the surface ocean will reduce the ocean's ability to absorb excess CO2from the atmosphere. Each of these effects taken alone would affect the climate forcing from a pulse of emitted CO2 by a factor of three or more; but here we show that, taken together, they compensate for each other. The net result is that the global warming potential of CO2 relative to other radiatively active trace gases is nearly independent of the CO2emission scenario. Thus, the concept of the global warming potential remains useful, despite the nonlinearities in the climate system and uncertainties in future emissions."Abstract Is there a plain English version?  Speaking as someone with a cup of fore-brain removed - and what was left now being sprayed with radiation and given chemo' therapy' to prevent any healing  I can only say that I followed what it was saying. Perhaps you should reduce your 'Fosters' intake?  |
|
|
|
Post by missouriboy on Jun 16, 2021 22:49:42 GMT
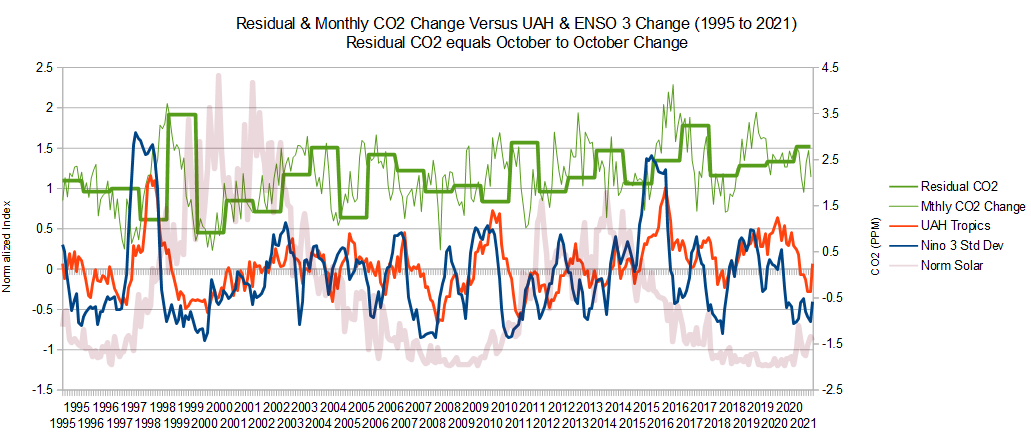
Total Atmospheric CO2 and Anthropogenic CO2 Emissions (1958-2021) With Comparisons to ENSO and UAH Temperatures I found an official data source provides annual World (and country) CO2 emissions. I converted the World data from gigatons to PPM based on a conversion factor I found and integrated this with the Mauna Loa CO2 data. All data were converted back to monthly values. Chart 1 shows the residual (October to October) CO2 values compared to monthly anthropogenic data. Total CO2 change is up to 7 times greater than Anthropogenic and has a greater positive slope over the 63 year period. It is apparent that CO2 spikes occur largely during La Nina events. But these are superimposed on an upward trend, which suggests that warming oceans give off more CO2. Chart 2 is a replica of the one I've used to show the lagging relationship of UAH Lower Troposphere temperatures to ENSO. It seems equally clear that CO2 spikes lag UAH temperatures, which lag EL Nino events.   |
|
|
|
Post by missouriboy on Jun 24, 2021 5:45:11 GMT
|
|
|
|
Post by duwayne on Jun 25, 2021 2:17:06 GMT
That’s a great article and exposes Gore and Nye for the frauds they are. Fortunately, my proposed experiment for testing Nautonnier’s hunch that LWIR will cool the ocean doesn’t have the fatal flaw in the Gore/Nye experiment. The LWIR passes directly to the water surface through air. Putting glass in the way would absorb the LWIR. One thing I would caution here for some who may not read the whole article. This article does not conclude that CO2 is not a “greenhouse gas”. Watt’s words are “I should make it clear that I’m not doubting that CO2 has a positive radiative heating effect in our atmosphere, due to LWIR re-radiation, that is well established by science.” |
|
|
|
Post by nautonnier on Jun 25, 2021 13:54:04 GMT
That’s a great article and exposes Gore and Nye for the frauds they are. Fortunately, my proposed experiment for testing Nautonnier’s hunch that LWIR will cool the ocean doesn’t have the fatal flaw in the Gore/Nye experiment. The LWIR passes directly to the water surface through air. Putting glass in the way would absorb the LWIR. One thing I would caution here for some who may not read the whole article. This article does not conclude that CO2 is not a “greenhouse gas”. Watt’s words are “I should make it clear that I’m not doubting that CO2 has a positive radiative heating effect in our atmosphere, due to LWIR re-radiation, that is well established by science.” There is nothing in Biden's head, so nothing to panic about |
|