|
|
Post by sigurdur on Aug 30, 2020 4:25:13 GMT
😅😅😅🤣🤣🤣😅😅😅
|
|
|
|
Post by missouriboy on Sept 1, 2020 20:03:17 GMT
That is their forecast (projection). Assuming that SC25 started in November, 2019, sunspots for the first 10 months of SC25 compare to SC23 and SC24 as follow. For the first 24 months, SC24 accumulated between 70 and 80% of SC23 sunspots for the same period. To date (10 months), SC25 has only accumulated about 40% of SC24's total for 10 months ... although the monthly percentage has been increasing. Slow starting horse. 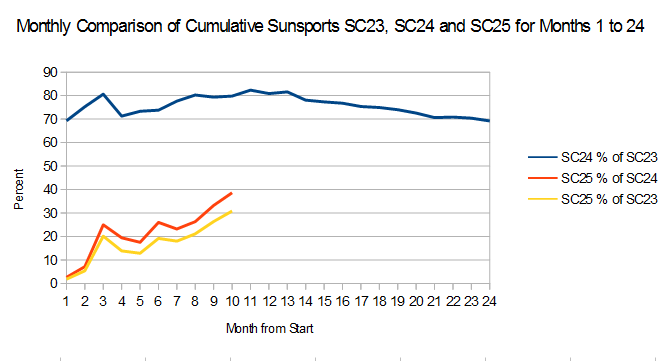 |
|
|
|
Post by nonentropic on Sept 1, 2020 21:09:19 GMT
That says it all and the SC24 numbers were low also.
With the usual lag it will be interesting to see how the CAGW story performs against the actual climate data.
|
|
|
|
Post by missouriboy on Sept 1, 2020 21:30:44 GMT
That says it all and the SC24 numbers were low also. With the usual lag it will be interesting to see how the CAGW story performs against the actual climate data. Dr Roy's UAH global temp for the lower troposphere for August 2020 is back down to +0.43 c ... so May, June, July and August are +0.54, +0.43, +0.44 and +0.43. That should be the lag off of the low pre-cycle El Nino. September or October should start showing some significant (?) declines as La Nina progresses. Quite a decline from the +0.76 C in February. Splaining time soon for the prophets.  |
|
|
|
Post by nonentropic on Sept 2, 2020 1:46:14 GMT
La Nina could back of again but our man Astro is lining up to becoming a sage.
fingers crossed its not some weak slide down that allows Splaining opportunities.
|
|
|
|
Post by missouriboy on Sept 4, 2020 13:26:32 GMT
This came out on Watchers.news while I was gone. The paper is on cosmic radiation but has some comparison of SC24 sunspots to Dalton Minimum (SC5-6) and Gleissberg Minimum (SC12-13). I do not have comparable monthly sunspot tallies for years before 1823. The authors comparison chart is below and the paper link is: agupubs.onlinelibrary.wiley.com/doi/epdf/10.1029/2019SW002428Note that the numbers of sunspots between SC5 and SC6 are visually much less than between SC12 and SC13. 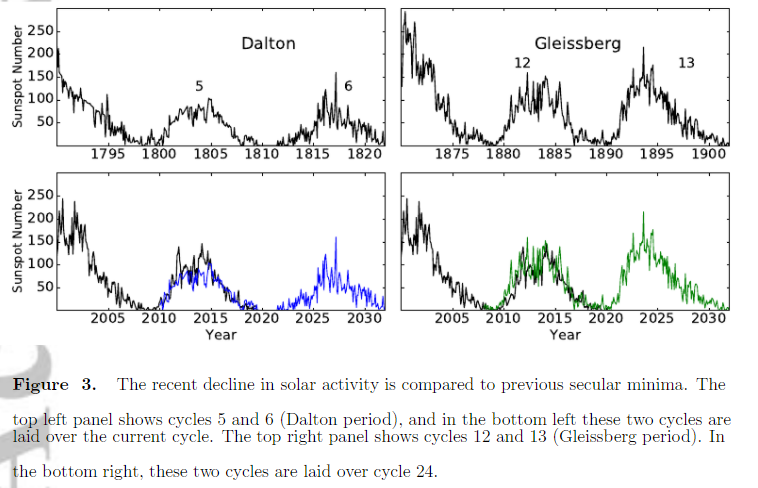 |
|
|
|
Post by acidohm on Sept 6, 2020 14:52:54 GMT
This came out on Watchers.news while I was gone. The paper is on cosmic radiation but has some comparison of SC24 sunspots to Dalton Minimum (SC5-6) and Gleissberg Minimum (SC12-13). I do not have comparable monthly sunspot tallies for years before 1823. The authors comparison chart is below and the paper link is: agupubs.onlinelibrary.wiley.com/doi/epdf/10.1029/2019SW002428Note that the numbers of sunspots between SC5 and SC6 are visually much less than between SC12 and SC13. This touches on something you bought up Missouri, perhaps large temp difference day to day is a good meridionality proxy?? |
|
|
|
Post by nautonnier on Sept 6, 2020 15:04:09 GMT
|
|
|
|
Post by missouriboy on Sept 6, 2020 17:29:45 GMT
This came out on Watchers.news while I was gone. The paper is on cosmic radiation but has some comparison of SC24 sunspots to Dalton Minimum (SC5-6) and Gleissberg Minimum (SC12-13). I do not have comparable monthly sunspot tallies for years before 1823. The authors comparison chart is below and the paper link is: agupubs.onlinelibrary.wiley.com/doi/epdf/10.1029/2019SW002428Note that the numbers of sunspots between SC5 and SC6 are visually much less than between SC12 and SC13. This touches on something you bought up Missouri, perhaps large temp difference day to day is a good meridionality proxy?? Right you may be. Temp is about the only daily metric that we have going back 100-120 years for certain stations. Columbia, MO is one of those for which I have collected the records. We are known for extreme changes when strong fronts push through. The CET also has daily records. I'll take a look. |
|
|
|
Post by dontgetoutmuch on Sept 15, 2020 16:30:00 GMT
|
|
|
|
Post by missouriboy on Sept 15, 2020 18:56:43 GMT
|
|
|
|
Post by missouriboy on Sept 15, 2020 21:24:09 GMT
|
|
|
|
Post by missouriboy on Sept 23, 2020 2:54:41 GMT
The transition from Solar Cycle 5 to 6 included a period of 21 months where NO sunspots were counted. This is the longest such period in the records. Given the greater accuracy of today's instrumentation, we may be counting very small spots that were not counted in earlier periods. To be comparable to the SC5-6 transition, we would likely need at least another year of almost no sunspots. This would bring us squarely to Astro's 2021-22 winter. The first large rise in SC6 sunspot activity occurred much later than usual, at least 5 years into the cycle. The VEI-7 Tambora eruption occurred just as this "fireup" was underway. 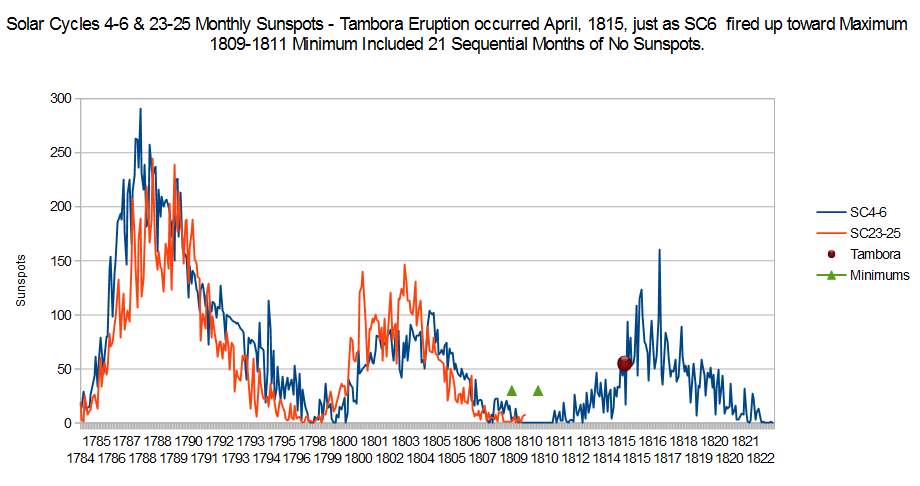 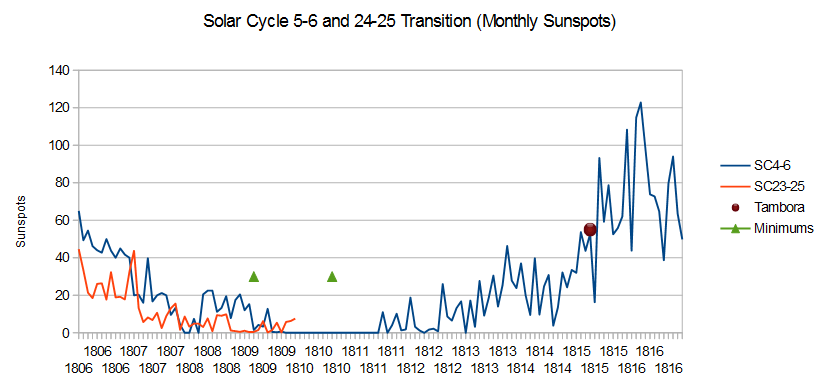 |
|
|
|
Post by glennkoks on Sept 23, 2020 13:11:27 GMT
Keep in mind that our cycles are probably skewed a little by the fact that we count almost every little sunspot nowadays as well. Many tiny sunspots went uncounted in the Dalton Minimum. They all get counted now. So a graph of the Dalton would look a little higher the way they count them now.
Similar to the way we name every patch of tropical clouds that comes close to meeting the criteria. In the old days how many small fish storms never even were recorded until the satellite era?
|
|
|
|
Post by acidohm on Sept 23, 2020 17:09:08 GMT
Keep in mind that our cycles are probably skewed a little by the fact that we count almost every little sunspot nowadays as well. Many tiny sunspots went uncounted in the Dalton Minimum. They all get counted now. So a graph of the Dalton would look a little higher the way they count them now. Similar to the way we name every patch of tropical clouds that comes close to meeting the criteria. In the old days how many small fish storms never even were recorded until the satellite era? A guy in Austria has Wolf's telescope from 1750. It would be quite easy to compare what we see now to what he did... |
|