|
|
Post by radiant on Aug 19, 2009 18:38:26 GMT
With reference to ocean.dmi.dk/arctic/lincoln.uk.phpI noticed that over the last 3 days the southerly ice flow down Nares strait has stopped and ice has attempted to move back into the lincoln sea part of the arctic ocean. Might be strong winds but still interesting to see blocks of ice about 60km by 30Km or larger going against the current which usually significantly moves the ice each day southerly down the strait  ocean.dmi.dk/arctic/images/MODIS/Lincoln/200908191633.ASAR.jpgocean.dmi.dk/arctic/images/MODIS/Lincoln/200908182211.ASAR.jpgocean.dmi.dk/arctic/images/MODIS/Lincoln/200908171557.ASAR.jpg ocean.dmi.dk/arctic/images/MODIS/Lincoln/200908191633.ASAR.jpgocean.dmi.dk/arctic/images/MODIS/Lincoln/200908182211.ASAR.jpgocean.dmi.dk/arctic/images/MODIS/Lincoln/200908171557.ASAR.jpgOne of these radar pictures appears to show fog lower than the large ice flows? I dont think it can be snow on new or small ice. Normally a visible spectrum picture of this area will show the ocean floor to prove there is no ice present when there are no big chunks present. But fog rules out wind. Satellite coverage has been poor for about 4 days so no recent visible images. The flows are not frozen because they are moving back out to the arctic. The pictures show about 250KM left to right. The narrowest part of Nares strait is 38km wide The picture below shows the Labrador current that partly arises from Nares Strait which is an important exit route for water that is entering the arctic cooling area. 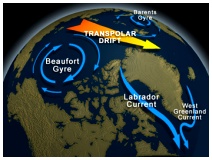 The bigger picture: 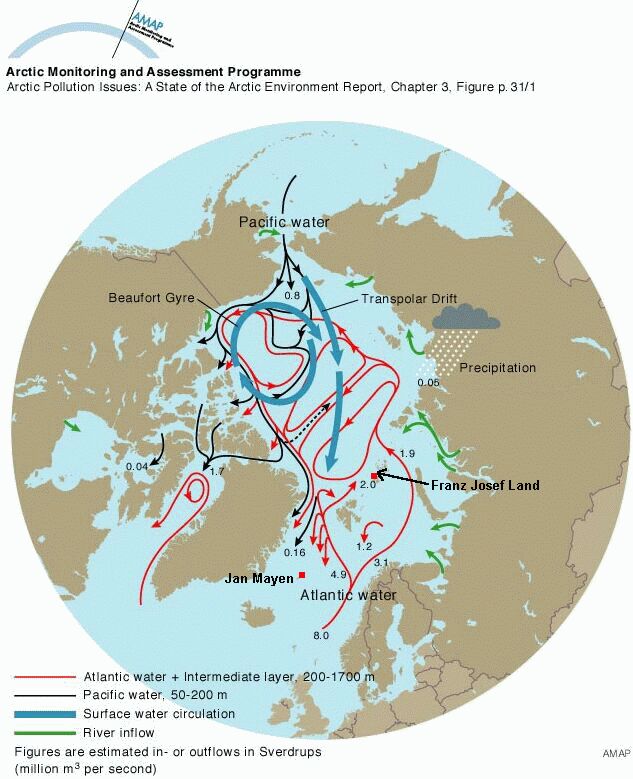 |
|
|
|
Post by ron on Aug 19, 2009 22:07:11 GMT
Let me put my 2 cents worth on the fate of the 6 yatchs. I hope all 6 get smashed to smithereens. It would be a pity if there were casualties, but I would not shed any tears if there were. People who play with fire, can get burned. Maybe if some serious damage gets done, future idiots will think twice before causing the Canadian Coast Guard to take actions that ought to be completely unnecessary. They really SHOULD be brought up on child endangerment charges, just as if they had left the kids in a hot car  . |
|
|
|
Post by neilhamp on Aug 19, 2009 22:08:22 GMT
|
|
|
|
Post by ron on Aug 19, 2009 22:10:15 GMT
The media really has become an arm of the leftwing governments. Ummm, this has been the case for at least the nearly 40 years since I've been politically aware. Doesn't 40 years make a trend? Not according to those media bias deniers! LOL |
|
|
|
Post by hilbert on Aug 19, 2009 22:21:24 GMT
 Is the poll using these data? |
|
|
|
Post by hilbert on Aug 19, 2009 22:22:35 GMT
and, are you going to publish our predictions after September/October?
|
|
|
|
Post by hilbert on Aug 19, 2009 22:29:45 GMT
|
|
|
|
Post by matt on Aug 19, 2009 23:44:25 GMT
and, are you going to publish our predictions after September/October? Already told you mine - 4.5, with a ballot-stuffing change to 4.0 in order to build the square 4.5 +- 0.5 box. (I'm strange that way) You can sure see the trans-polar drift now. Solid ice in a cone above Greenland and Svalbard, weak ice arched above it, and clear water towards Siberia and the Bering Straight. The winds going against the currents sure have spread out the ice. As Radiant noted, some ice is even going backwards. It's important to remember that all the ice in the Canadian archipelago is on its way South (eventually) and so is, so to speak, Dead Ice Floating. As the old ice shoved up against the islands breaks up, it flows more easily into the straits. This could mean that for the next few years the NW passage will have a lot of ice, though probably still more or less navigable. In conclusion, it looks like the ice continues to thin and we'll probably get yet another record low volume. It almost certainly will be a record low average thickness and extent will be far below the extent trend. |
|
|
|
Post by bluecon on Aug 20, 2009 1:16:24 GMT
and, are you going to publish our predictions after September/October? Already told you mine - 4.5, with a ballot-stuffing change to 4.0 in order to build the square 4.5 +- 0.5 box. (I'm strange that way) You can sure see the trans-polar drift now. Solid ice in a cone above Greenland and Svalbard, weak ice arched above it, and clear water towards Siberia and the Bering Straight. The winds going against the currents sure have spread out the ice. As Radiant noted, some ice is even going backwards. It's important to remember that all the ice in the Canadian archipelago is on its way South (eventually) and so is, so to speak, Dead Ice Floating. As the old ice shoved up against the islands breaks up, it flows more easily into the straits. This could mean that for the next few years the NW passage will have a lot of ice, though probably still more or less navigable. In conclusion, it looks like the ice continues to thin and we'll probably get yet another record low volume. It almost certainly will be a record low average thickness and extent will be far below the extent trend. How are you determining the thickness of the ice? The Caitlin teams results? That is funny. You have no idea what the volume of the ice is this year compared to other years. Just clutching at straws. The Earth is cooling and the ice is increasing. Jump ship before you look more foolish. The global cooling can only be covered up for so long. |
|
|
|
Post by sigurdur on Aug 20, 2009 1:50:49 GMT
Already told you mine - 4.5, with a ballot-stuffing change to 4.0 in order to build the square 4.5 +- 0.5 box. (I'm strange that way) You can sure see the trans-polar drift now. Solid ice in a cone above Greenland and Svalbard, weak ice arched above it, and clear water towards Siberia and the Bering Straight. The winds going against the currents sure have spread out the ice. As Radiant noted, some ice is even going backwards. It's important to remember that all the ice in the Canadian archipelago is on its way South (eventually) and so is, so to speak, Dead Ice Floating. As the old ice shoved up against the islands breaks up, it flows more easily into the straits. This could mean that for the next few years the NW passage will have a lot of ice, though probably still more or less navigable. In conclusion, it looks like the ice continues to thin and we'll probably get yet another record low volume. It almost certainly will be a record low average thickness and extent will be far below the extent trend. How are you determining the thickness of the ice? The Caitlin teams results? That is funny. You have no idea what the volume of the ice is this year compared to other years. Just clutching at straws. The Earth is cooling and the ice is increasing. Jump ship before you look more foolish. The global cooling can only be covered up for so long. I hear there may be a bit of shipjumping this year in the Arctic. I wonder if they will come home and tell us all how warm it is there. |
|
|
|
Post by kiwistonewall on Aug 20, 2009 6:59:46 GMT
Have updated this to the 19th: Note all the young ice totally unregistered with the Satellite. There is a lot more ice there than the Jaxa Algorithms compute. (Unless Alaska is deliberately reporting LOTS more ice because they don't believe in AGW? Anything is possible I guess.) Inside the Areas of the Alsakan chart, you can read White=multi-year ice & Blue = first year ice  |
|
|
|
Post by bluecon on Aug 20, 2009 12:16:10 GMT
|
|
dresi
Level 3 Rank

Posts: 120
|
Post by dresi on Aug 20, 2009 18:22:30 GMT
I changed my estimate to 5.2, because forecast is showing that temperature will go up especially near Alaska coast.
|
|
|
|
Post by kiwistonewall on Aug 20, 2009 21:51:07 GMT
Who is correct about ice North of Alaska? The Alaskan charts? Or Jaxa Satellite. The Canadian charts for the Alaskan region seem to be closer to the Jaxa images. The Alaskan charts (as I show above) show way more ice. Alaska: pafc.arh.noaa.gov/data/ice/ice.pngIf the Canadians chart this region from Satellite & the US via overflying planes, that could account for difference. Anyone up that way want to comment? |
|
|
|
Post by radiant on Aug 21, 2009 6:21:05 GMT
Who is correct about ice North of Alaska? The Alaskan charts? Or Jaxa Satellite. The Canadian charts for the Alaskan region seem to be closer to the Jaxa images. The Alaskan charts (as I show above) show way more ice. Alaska: pafc.arh.noaa.gov/data/ice/ice.pngIf the Canadians chart this region from Satellite & the US via overflying planes, that could account for difference. Anyone up that way want to comment? Some comments on this: From the Barrow web cam i have not seen any ice at all for about two weeks. When i did see ice in the last month it was low concentration. I check the cam at least 3 times a day. To begin with there seemed a range of hills in the far distance and i am now assuming this was the ice edge that is no longer visible. If so then relatively the ice must have been quite near. Philipe on Fleur Australe commented today that he has never seen such a difficult sea and swell with such little wind in the Dolphin strait so i am assuming that something further out is creating that swell. Maybe the ice is being blown inwards to create the hole that does appear to exist from canadian and danish data. The USA data shows confidence of low to moderate. With perhaps 3 weeks to go before refreeze 2007 is still not impossible. If only we had satellite pictures of the area!! For example the Nares strait is still not significantly moving and is clear to see though mostly covered with cloud: ocean.dmi.dk/arctic/images/MODIS/Lincoln/20090820TERR.jpgIt would be easy to read the ice with such picture quality without clouds. If you add in the radar pictures any one of us could produce a reliable figure given sufficient time. ocean.dmi.dk/arctic/images/MODIS/Lincoln/200908201602.ASAR.jpg However sea ice formation has as much to do with mixing of the water, amount of river water entering the area, ocean currents, storms, and amount of precipitation as it has to do with amount of cold above the sea. Whatever the extent i think we still have to ask what does it mean when it changes? |
|


 .
.

