|
|
Post by icefisher on Oct 26, 2012 20:13:07 GMT
icefisher, As well as it just being a bit of fun... In the febrile blogosphere following a particularly cold temperatures there are (and were) a lot of silly comments about how the AGW scientists will be worried for their jobs, will be moving over to the cold side, how the wheels are falling off the bandwagon, how all the evidence is pointing to cooling etc. etc. etc. Even you will occasionally bring up Akasofu's silly plot suggesting we'd started on a cooling trend a few years ago. Yet nearly 25 years on from the Hansen presentation (and 30-40 years after CO2-related warming was starting to be taken seriously), the band wagon still has plenty of wheels even while the complexity of the issues relating to the warming grows. Putting people on the spot with a specific question, is useful to see what they *really* expect, or whether what they are saying and hinting is just optimistic blather. Well I guess the answer is they are uncertain then. Not sure how deep the budget cuts Trenberth talked about go, but it clear that "bandwagon" will keep rolling as long as it has tires. I recall running some analysis a year ago on what it would take to get .2C out of the next decade given the first year was a bust. I remember noting a record warming would need to ensue immediately. Now another year is in and no help there. And whats the short term prognosis? Well you have solar maximum, the warm phase of the ENSO (though its being squelched by something), and ocean momentum all working against cooling. I agree the solar max is weak, the ENSO is weak, but ocean momentum should be significant as ocean warming has lagged a great deal over the last century of warming. I don't know what the sun or the ocean states will do but help for you seems remote from either of those. As the short term maxs and momentum wane there will be a need for something to replace them. Are you banking on continued CO2 emissions to fill the void? Could we hit a .540 for next year? Sure! We will have to see how the ENSO performs on top of solar max. But isn't a strong ENSO due to be pogo sticking off of higher CO2 forcing for something more in the vein of a .740? Your prediction for the 2010's was for a .677 average (measured by your favorite Hadcrut4). Are you still certain of that? At any rate its currently at .409 down from the 2010 average of .477 and this is supposed to be the jolly warming times for this decade! Astromet has the effects for the next major El Nino at the beginning of the next decade. We had to listen for years to you guys telling us it was a step change function and that we needed to wait until the decade to turn to see the next step. That has come and gone and no step. So if you are still convinced how do you see us getting where you think we are going? |
|
|
|
Post by magellan on Oct 27, 2012 20:58:42 GMT
magellan, It's quite odd that you would still think that the above is a good argument for supporting satellite measurements over the land surface record. You can have the most perfect sensor, but if it is measuring a moving target it will have problems and *has* had problems - or have you forgotten the numerous adjustments that converted UAH from originally showing no warming trend into UAH showing a warming trend!? *All* systems have their quirks, and the quirks need to be understood. The MSU satellites suffer from many biases related to, for example, spacecraft altitude, the drift of the orbit, the temperature of the spacecraft and problems with the instrument. If you assume from Roy "it's so simple" Spencer's posts that these issues are not significant, you are naive. The need to deal with these issues is great for people like you who want to make easy, but specious, arguments about how the analysis process is simply adjusting the data to confirm a warming bias. Doesn't mean you aren't talking nonsense though. The question is poor because it massively oversimplifies the issue. When you combine the effects of natural variability and the difficulty of converting the raw radiance measurements into a homegenous dataset, the uncertainties in the satellite trend are large, and not inconsistent with the model trends. I also think it is a little strong to imply that this aspect is a core element of the theory of anthropogenically-caused global warming. The models are probably about right, but they could be wrong for a variety of reasons that do not affect the core theory. Obviously, if you pretend that there was no big El Nino in the late 1990s and pretend that the troposphere has a relatively fixed structure that warms evenly over time, then you could prove any old nonsense - as Douglass did. Santer 08 was an attempt to discredit Douglass 07. What he ended up doing was what every other rabid AGW fraudster does; defraud. What is it you don't understand about this graph? Anyone can go to Climate Audit and follow the timeline when SM first asked Santer for his data used in Santer 08, for which Santer refused and told SM not to contact him anymore on the matter. The Team circled the wagons and tried to prevent SM from 1) getting the data and 2) publishing MM10. What part of this graph don't you understand?  |
|
|
|
Post by duwayne on Nov 27, 2012 22:20:32 GMT
duwayne Santer's paper was about detecting trends in the satellite record IIRC. I don't imagine his number will change. Given that we are gathering more data about the state of the climate, I would hope that in 5 years' time we would have a much more self-consistent picture of energy in the climate system based on combining the temperature data with the satellite radiation measures, the ocean heat content data, the GRACE mass balance data measuring ice caps, sea level data and so forth. Combining all these data will shorten, not lengthen, the period required to detect a "global warming" signal. Steve, I'm referring to real data not models which show no signs of having any predictive capability. Look at the failure of ENSO predictions which are a minute but meaningful portion of the total ocean/atmosphere machine. If there is an Ocean Current cycle of approximately 60 years and it is a key driver of global temperatures, then you cannot get an accurate picture of the long term temperature trend by looking at 15 or 30 years of data. The AGW scientists are now telling us that 17 years isn't enough. Until temperatures begin to go up again, they'll argue that flat temperatures don't tell the long term story. The PDO continues unabated in its cool phase. Think 2037. |
|
|
|
Post by sigurdur on Nov 28, 2012 14:39:00 GMT
|
|
|
|
Post by Pooh on Nov 29, 2012 6:03:28 GMT
|
|
|
|
Post by duwayne on Nov 29, 2012 11:44:10 GMT
Pooh, what is the main message from this book? I haven't read it. |
|
|
|
Post by duwayne on Nov 29, 2012 15:16:11 GMT
Wow! Duwayne The Met.Office are predicting much hotter tempertures www.metoffice.gov.uk/research/climate/seasonal-to-decadal/long-range/decadal-fcThey are saying 0.54 for 2012-16 and 0.76 for 2017-21 "Global average temperature is expected to rise to between 0.36 °C and 0.72 °C (90% confidence range) above the long-term (1971-2000) average during the period 2012-2016, with values most likely to be about 0.54 °C higher than average (see blue curves in the Figure 1 below). From 2017 to 2021, global temperature is forecast to rise further to between 0.54 °C and 0.97 °C, with most likely values of about 0.76 °C above average. The warmest year in the 160-year Met Office Hadley Centre global temperature record is 1998, with a temperature of 0.40 °C above the long-term average. 2009 had a temperature of 0.32 °C above average. The forecast trend of further global warming is largely driven by increasing levels of greenhouse gases."  They have to "catch up" somewhere along the way or retract what they have been saying for years. The black line is observed. The white with red confidence intervals their previous predictions The blue lines their latest prediction. The break in that line is far larger than the break in the Pinatubo break. Wonder what explanation they have for that. At least they have taken a break on providing advice for the upcoming seasons apparel choices and winter snow clearing equipment and stockpile budgeting decisions after taking that in the shorts so often. Here's a comparison of the 1995 Met Office forecast from the chart above with actual global temperatures for 2007 - 2012. 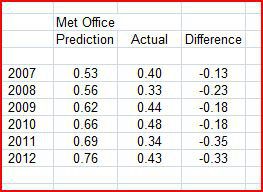 I've copied the Met Office chart, expanded it and read the 1995 global temperature forecast anomalies for 2007 through 2012 (white line). I selected 2007 as the beginning point since that's when the PDO turned negative for what last 3 decades into the future. I've then adjusted the anomalies to the same base as the Hadcrut3 temperature anomalies by adding 0.12C. (The Met Office anomalies are from a 1971-2000 baseline while the Hadcrut3 anomalies have a 1961-1990 baseline. The adjusted values could be off by a hundredth of a degree or so.) The actual temperatures are the Hadcrut3 anomalies in degrees C. (I've estimated the 2012 full year temperatures from the data through October, with November and December at 0.55 and 0.50 C respectively.) The Met Office Forecast anomalies are far above actual - more than 0.3C too high for each of the last 2 years. This forecast and by extension the climate models would seem to have no scientific value. I do ,however, appreciate that the Met Office provide the historical forecasts as part of their forecast updates so one can judge their accuracy. |
|
|
|
Post by Pooh on Nov 30, 2012 6:21:07 GMT
Pooh, what is the main message from this book? I haven't read it. Primarily expository, it explains in detail (words and graphics) the operation of "ENSO" (LaNina and ElNino). Then, "ENSO is a variable source of naturally created and released thermal energy, and because the climate models can't simulate it, the scientists who rely on these models cannot determine if past long-term warming and cooling of global surface temperatures are actually the results of manmade greenhouse gases." Of importance, the oceans are 70% of the surface of the earth and contain a larger percentage of the earth's retained heat. The cycles of ocean temperature are reflected in land surface temperature. Implied, the models have the tail wagging the dog. Try this for "the Table of Contents; the Introduction; the beginning of Section 1, with the cartoon-like illustrations; the discussion About the Cover; and the Closing." bobtisdale.files.wordpress.com/2012/09/preview-of-who-turned-on-the-heat-v2.pdf |
|
|
|
Post by karlox on Nov 30, 2012 16:57:20 GMT
Pooh, what is the main message from this book? I haven't read it. Primarily expository, it explains in detail (words and graphics) the operation of "ENSO" (LaNina and ElNino). Then, "ENSO is a variable source of naturally created and released thermal energy, and because the climate models can't simulate it, the scientists who rely on these models cannot determine if past long-term warming and cooling of global surface temperatures are actually the results of manmade greenhouse gases." Of importance, the oceans are 70% of the surface of the earth and contain a larger percentage of the earth's retained heat. The cycles of ocean temperature are reflected in land surface temperature. Implied, the models have the tail wagging the dog. Try this for "the Table of Contents; the Introduction; the beginning of Section 1, with the cartoon-like illustrations; the discussion About the Cover; and the Closing." bobtisdale.files.wordpress.com/2012/09/preview-of-who-turned-on-the-heat-v2.pdfI´ve read all 13 pages from the link. I´ve learned to understand how ENSO builds up and down and what has started to happen already, with a clear shift to cooler phases from current Neutral Conditions... I bet the book is worth for whatever price! it is all explained in plain words and graphics which is what I´ve liked the most. Thanks Sigur! |
|
|
|
Post by karlox on Nov 30, 2012 16:58:03 GMT
Meant Thanks POOH!!!
|
|
|
|
Post by Pooh on Dec 1, 2012 6:51:48 GMT
Karlox: Glad you found it of interest; I've followed Bob Tisdale for a few years now. The price is $8.00 delivered to your desktop as a PDF. It's a lot of work and research for that price. Much better than the paywalls you see elsewhere. If you order it, make sure it is the updated version. Four typos corrected. BTW, the animations are available here: Tisdale, Bob. “Animations Discussed in ‘Who Turned on the Heat?’” Scientific. Bob Tisdale - Climate Observations, September 3, 2012. bobtisdale.wordpress.com/2012/09/03/animations-discussed-in-who-turned-on-the-heat/
|
|
|
|
Post by karlox on Dec 1, 2012 23:40:36 GMT
Karlox: Glad you found it of interest; I've followed Bob Tisdale for a few years now. The price is $8.00 delivered to your desktop as a PDF. It's a lot of work and research for that price. Much better than the paywalls you see elsewhere. If you order it, make sure it is the updated version. Four typos corrected. BTW, the animations are available here: Tisdale, Bob. “Animations Discussed in ‘Who Turned on the Heat?’” Scientific. Bob Tisdale - Climate Observations, September 3, 2012. bobtisdale.wordpress.com/2012/09/03/animations-discussed-in-who-turned-on-the-heat/ I consider myself an open minded person, meaning by that that I am sure I don´t know most things I don´t even Know I don´t Know... Politics pollute scientific discussion. And there are too much politics and crossed interest involved in climate-changes discussion... And certainly there is a politic use of CO2 emissions and of cocaine production, for instance... just think what the world would be like if China jumps ahead of green economy, stops polluting without control etc... We are living for first time in humanity in a time in which we are capable of measuring a hughe amount of variables and data and information from our sun, our oceans, our atmosphere, our planet... lucky we are... and just it´s happening right now we are entering in a solar cycle mode -nothing new- but never had the chance to measure and control it as today... and the data and figures shall speak for themselves... and beyond CO2 there is life for better understood climatology. |
|
|
|
Post by magellan on Dec 4, 2012 19:19:27 GMT
It is so much fun to go back and read quotes from the dimwits making predictions. Met Office : Scottish Skiing DoomedAlex Hill, chief government advisor with the Met Office, said the amount of snow in the Scottish mountains had been decreasing for the last 40 years and there was no reason for the decline to stop.
He added: “Put it this way, I will not be investing in the ski-ing industry. |
|
|
|
Post by karlox on Dec 4, 2012 19:34:51 GMT
It is so much fun to go back and read quotes from the dimwits making predictions. Met Office : Scottish Skiing DoomedAlex Hill, chief government advisor with the Met Office, said the amount of snow in the Scottish mountains had been decreasing for the last 40 years and there was no reason for the decline to stop.
He added: “Put it this way, I will not be investing in the ski-ing industry. For sure they are having quite a winter well in advance currently in UK, and it doesn´t look better for mid forecast... Still I am looking forward to see 1 and a half meters of snow in Madrid´s nearby mountains (1800m Amsl) as it happened once a few years ago... only once  |
|
|
|
Post by magellan on Dec 4, 2012 21:59:44 GMT
It is so much fun to go back and read quotes from the dimwits making predictions. Met Office : Scottish Skiing DoomedAlex Hill, chief government advisor with the Met Office, said the amount of snow in the Scottish mountains had been decreasing for the last 40 years and there was no reason for the decline to stop.
He added: “Put it this way, I will not be investing in the ski-ing industry. For sure they are having quite a winter well in advance currently in UK, and it doesn´t look better for mid forecast... Still I am looking forward to see 1 and a half meters of snow in Madrid´s nearby mountains (1800m Amsl) as it happened once a few years ago... only once People believe that stuff, that is the problem. Another example: stevengoddard.wordpress.com/2012/12/04/uk-government-advises-everybody-to-move-to-antarctica/And yet, a few apologists in this forum make excuses for such lunacy. |
|


